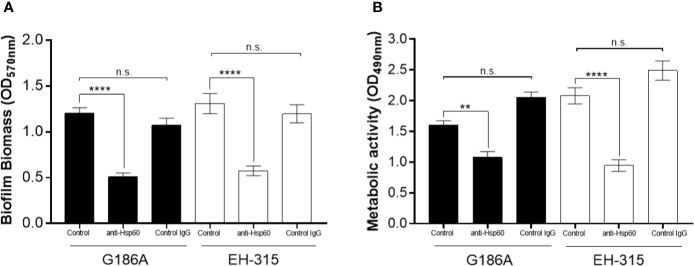
Figure 4.
Influence of Hsp60 in H. capsulatum EH-315 and G186A biofilm formation. (A) Quantification of total biomass by crystal violet staining and (B) quantification of metabolic activity by XTT reduction assay. Data are representative of three independent experiments and values expressed as mean ± SEM. **p < 0.01; ****p < 0.0001; n.s., not significant.

