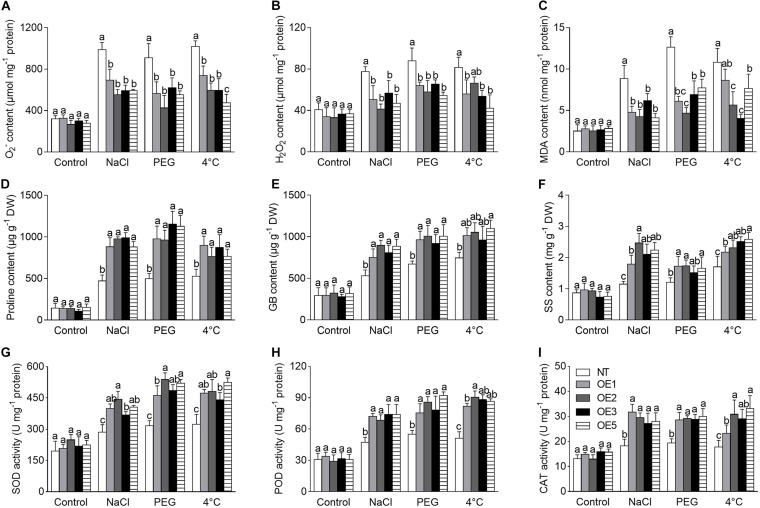
FIGURE 7.
Analysis of physiological performance of transgenic tobacco lines under NaCl, PEG, and 4°C treatments. (A–C) ROS level and MDA content. (D–F) Content of osmoprotectants. (G–I) The activity of antioxidant enzymes. NT: non-transgenic tobacco plant; OE1, OE2, OE3, OE5: T2 transgenic tobacco line 1, 2, 3, 5. NaCl: 200 mmol⋅L–1 NaCl; PEG: 20% PEG 6,000. DW: dry weight. O2–: oxygen free radical; H2O2: hydrogen peroxide; MDA: malondialdehyde; GB: glycinebetaine; SS: soluble sugar; SOD: superoxide dismutase; POD: peroxidase; CAT: catalase. Different lowercase letters indicate significant difference (P < 0.05) between transgenic lines and NT plants within the same treatment. Values are means ± SE of three replicates.

