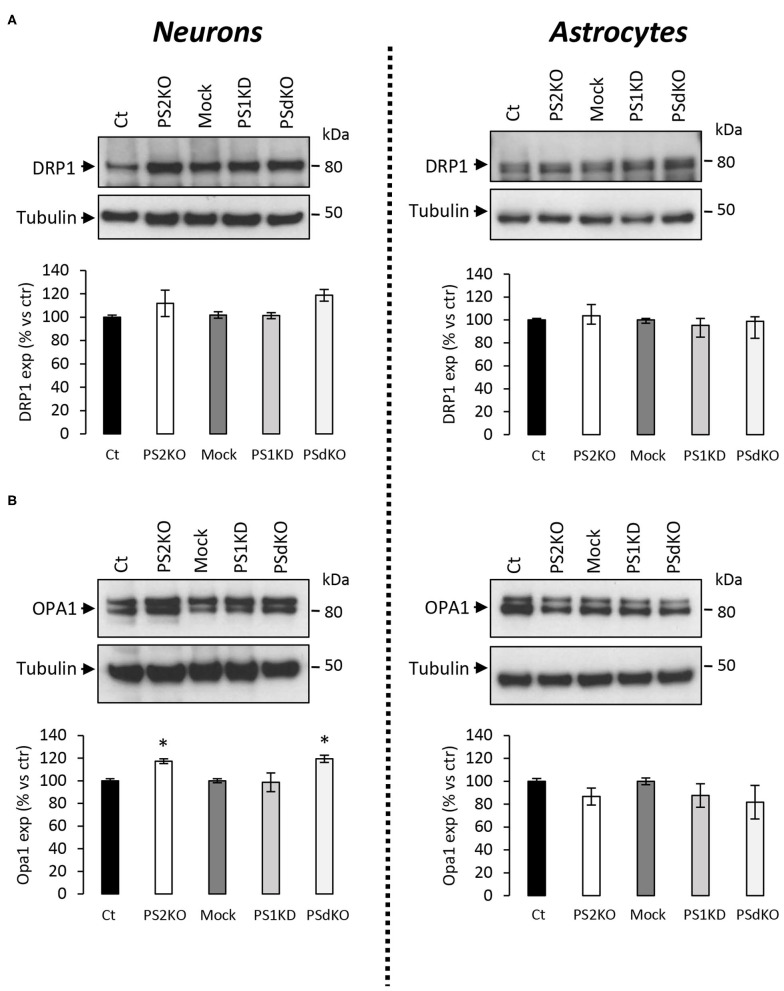
Figure 7.
Expression of mitochondrial fusion and fission proteins in PS-deficient primary nerve cells. Experiments were performed on primary DIV11 neuronal cultures and primary DIV24 astrocytes cultures. Cell conditions were Ct vs. PS2KO, Mock (infection control) vs. PS1KD and PSdKO. (A) Representative WBs and quantifications of DRP1 profile expression; in primary neuronal cell lysates (left panel) and in primary astrocyte cell lysates (right panel). Tubulin was used as a loading control. Results (mean ± sem) are expressed as percentage of the respective control (ctr = Ct or Mock) (min N = 2). Kruskal–Wallis test and Dunn's multiple comparison test. (B) Representative WBs and quantifications of OPA1 profile expression; in primary neuronal cell lysates (left panel) and in primary astrocyte cell lysates (right panel). Tubulin was used as a loading control. Results (mean ± sem) are expressed as percentage of the respective control (ctr = Ct or Mock) (min N = 4). ANOVA and Tukey's multiple comparison test, *p < 0.05.

