Figure 8.
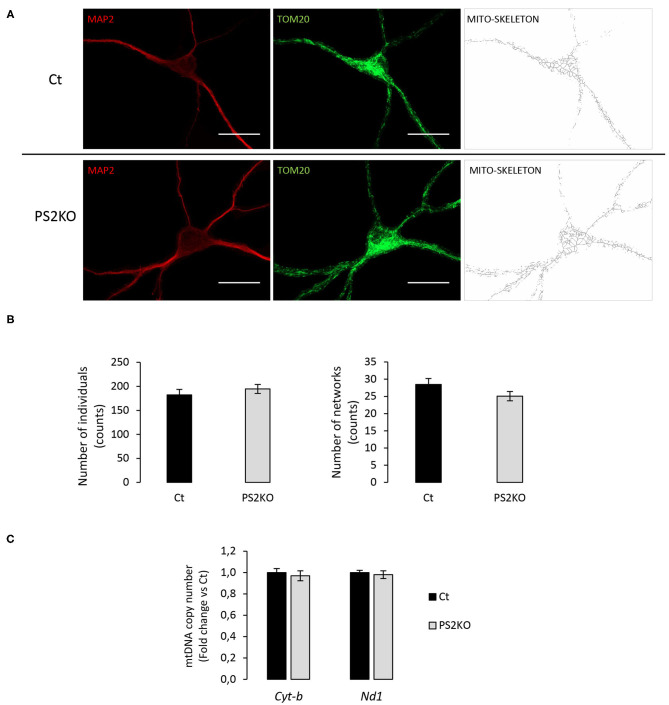
Evaluation of mitochondrial morphology and content in PS2KO neurons. (A) Mitochondria from wild-type non-infected (Ct) and PS2KO neurons at DIV11 were stained with an anti-TOM20 antibody (green) and mature neurons were identified with MAP2 (red). Confocal microscope images were acquired and TOM20 images were processed using the MiNA toolset to generate accurate mitochondrial skeletons for further analysis. Scale bar = 20 μm. (B) Quantification of individuals (counts) and networks (counts) are shown in the graphs. Results are presented as mean ± sem. Student's t-test (n = 55 from N = 3 independent experiments). (C) RT-qPCR analysis of mitochondrial DNA content (Cyt-b and Nd1 mitochondrial genes) in wild-type non-infected (Ct) and PS2KO neurons at DIV11. Results (mean ± sem) are expressed as percentage of the respective control (Ct) (min N = 4).

