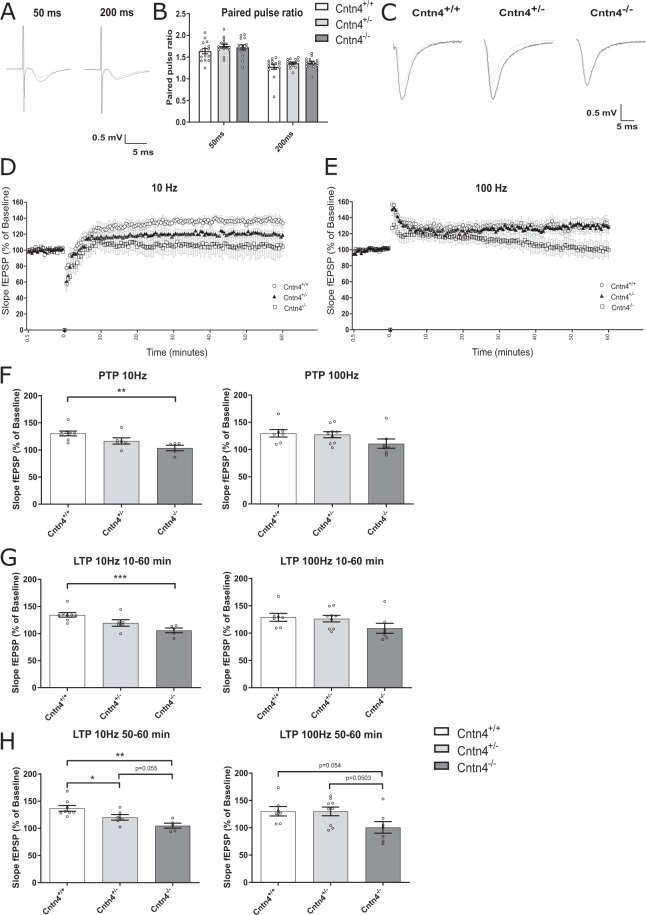
Fig. 1. The effect of Cntn4 deficiency on hippocampal synaptic potentiation.
A Representative fEPSP traces of the paired pulse ratio (PPR) recorded in the CA1 area of each mouse genotype at 50 ms (left) and 200 ms interval (right). To allow comparison between traces, the response to the first (gray) and second pulse (black) are here superimposed. B Paired pulse ratio (expressed as [slope second pulse/slope first pulse]*100%) in the hippocampal region at 50 ms and 200 ms inter-stimulus interval. Data between genotypes was analyzed by two-way ANOVA (p = 0.07). C Representative individual fEPSP traces taken from each genotype. The gray traces represent the baseline fEPSP, the black trace was taken between 50 and 60 min after tetanic stimulation. D Stimulation with 900 pulses at 10 Hz induced synaptic potentiation in the CA1 region of hippocampal slices in all groups. E Stimulation with 900 pulses at 100 Hz induced synaptic potentiation in the CA1 region of hippocampal slices in all groups. F Average post-tetanic potentiation (PTP) measurements at 10 Hz and 100 Hz, respectively. p = 0.003. G Average synaptic potentiation over 60 min (i.e., from 10 to 60 min post-tetanus) at 10 Hz and 100 Hz. P = 0.0009. H Average synaptic potentiation between 50–60 min (i.e., from period between 50 to 60 min post-tetanus) at 10 Hz and 100 Hz. 10 Hz: Cntn4+/+ vs. Cntn4+/- p = 0.047; Cntn4+/+ vs. Cntn4-/- p = 0.001; Cntn4+/- vs. Cntn4-/- p = 0.055. 100 Hz: Cntn4+/+ vs. Cntn4-/- p = 0.0503; Cntn4+/- vs. Cntn4-/- p = 0.054. 10 Hz Cntn4+/+: n = 8, Cntn4+/-: n = 6, Cntn4-/-: n = 5. 100 Hz Cntn4+/+: n = 7, Cntn4+/-: n = 9, Cntn4-/-: n = 7 mice. Data are expressed as means ± S.E.M.

