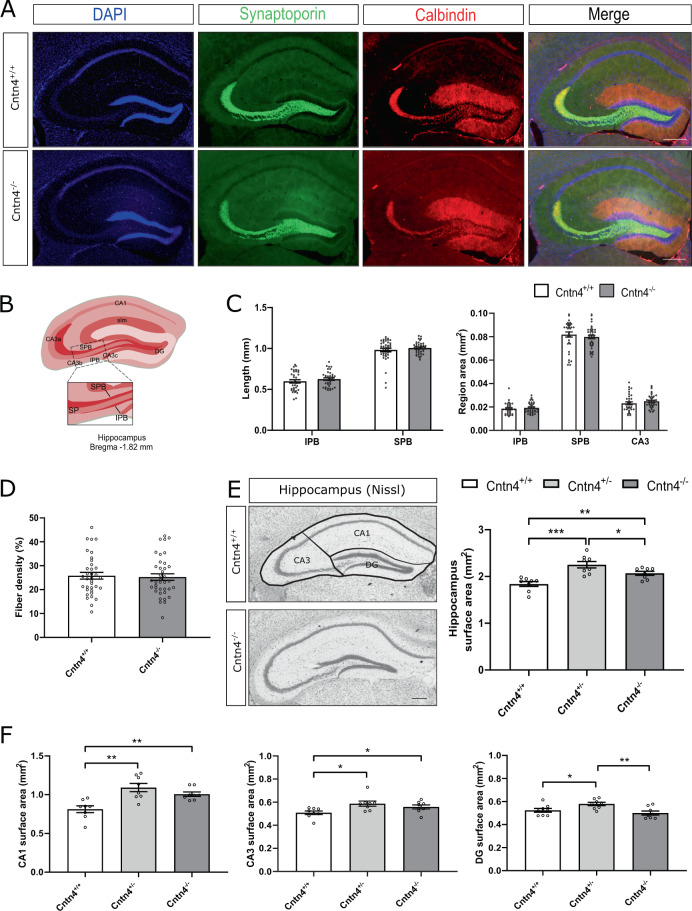
Fig. 2. Hippocampal mossy fiber distribution in Cntn4-deficient mice.
A Representative image of synaptoporin (green) and calbindin (red) expression in adult Cntn4+/+ and Cntn4-/- hippocampi. DAPI is in blue. The scale bars represent 250 µm. B Schematic representation of the adult mouse hippocampus. The rectangle indicates the area and location used for quantification of mossy fiber crossings in the SP of the CA3. Abbreviations: CA1 cornu ammonis, CA3a-c cornu ammonis 3a-c, DG dentate gyrus, SPB suprapyramidal bundle, IPB infrapyramidal bundle, SP stratum pyramidale, slm stratum lacunosum-moleculare. C Quantification of the length (left panel) and area size (right panel) of the IPB, SPB, and CA3 in Cntn4+/+ and Cntn4-/- mice showed no difference between genotypes. Analysis was performed on at least three sections per brain from Cntn4+/+ and Cntn4-/- mice (n = 6 mice per genotype) using unpaired Student’s t test. Data are presented as mean ± S.E.M. D Quantification of percentage of mossy fibers crossing the SP did not reveal a difference between Cntn4+/+ and Cntn4-/- mice. Analysis was performed on at least three sections per brain from Cntn4+/+ and Cntn4-/- mice (n = 6 mice per genotype) using unpaired Student’s t test. Data are presented as mean ± S.E.M. E Nissl-stained sections of Cntn4+/+, Cntn4+/-, and Cntn4-/- mice demonstrated a significant difference in hippocampal surface areas between genotypes. F Tracing of hippocampal subsections revealed significant area differences across all regions. Analysis was performed on at least two sections per brain from Cntn4+/+, Cntn4+/-, and Cntn4-/- mice (n = 4 mice per genotype) using unpaired Student’s t test and one-way ANOVA. Data are presented as mean ± S.E.M, p = 0.0004, 0.004, 0.04 (total hippocampus); p = 0.001, 0.003 (CA1); p = 0.01, 0.048 (CA3); p = 0.03, 0.004 (DG).

