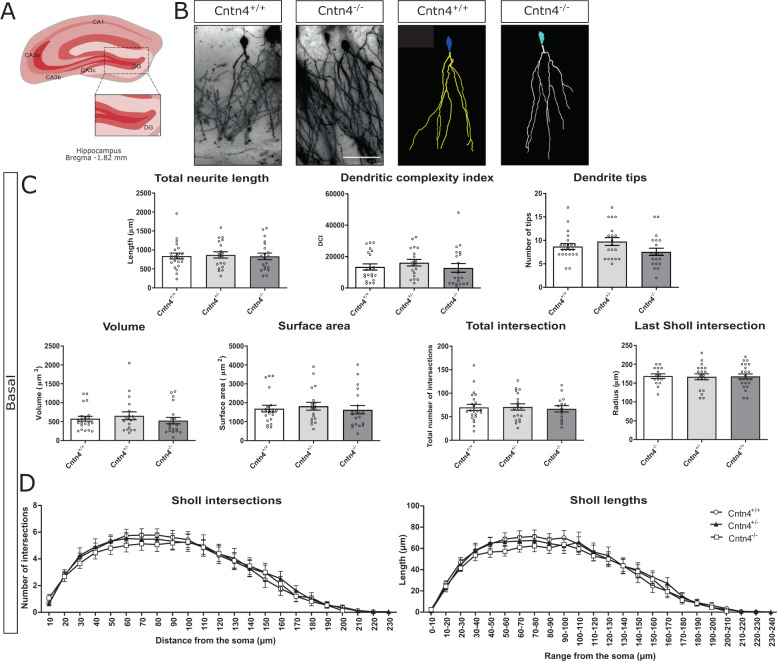
Fig. 4. Golgi analysis DG.
Neuron morphology analysis results for Cntn4+/+, Cntn4+/-, and Cntn4-/- mouse hippocampus DG. A Schematic representation of the dentate gyrus with labeled Bregma anterior-posterior. Adapted from Paxinos and Franklin, 2001. B Golgi staining in Cntn4+/+ and Cntn4-/- mice DG (left), exemplary tracings of neurons (right). The scale bar represents 40 µm. C Quantitative morphological results for the basal dendrites. D Sholl plots indicate the distribution of basal dendritic intersections and length at increasing distance from the center of the cell body. Quantitative analysis was performed, in each area, on at least six slices in Cntn4+/+, Cntn4+/-, and Cntn4-/- mice (n = 5 mice per genotype). Data are presented as mean ± S. E. M, n = 22 (Cntn4+/+), n = 19 (Cntn4+/-), n = 20 mice (Cntn4-/-).

