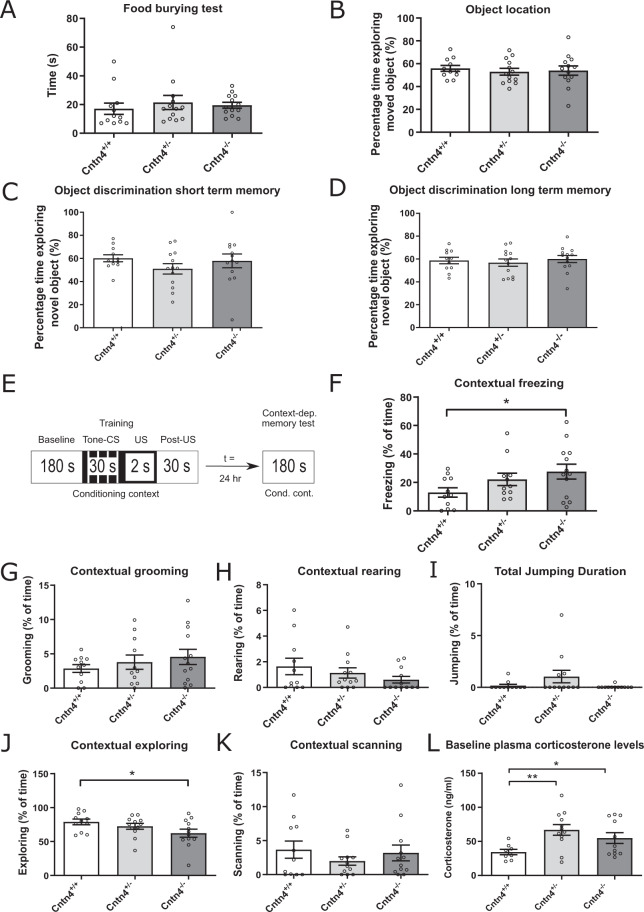
Fig. 5. Cntn4-deficient mice demonstrate same responses in object discrimination and object location tasks but altered fear conditioning responses.
A Average time finding the piece of chow (sec) after 24 h of food restriction. The food finding time shows no significant difference between genotypes (n = 38 mice). B Average exploration time on moved object (%). Calculated as Timenovel/Timenovel+familiar. All genotypes spent more time exploring the moved object, however there was no significant difference in exploration time between them (n = 37 mice). C, D Short-term and long-term recognition memory, respectively, in terms of average exploration time on novel object (%). Calculated as Timenovel/Timenovel+familiar. All genotypes spent more time exploring the moved object, however there was no significant difference in exploration time between them (n = 36 mice). Bars represent the means, error bars indicate the standard error of mean (S.E.M.). E Schematic presentation of the fear conditioning test sequence. F Percentage of time spent freezing during 180 s of exposure to a conditional context (without simulation such as tone or foot shock). Cntn4-/- mice spent significantly more time freezing compared to Cntn4+/+ mice (p = 0.043, n = 35 mice). G–I Percentage of time spent grooming, rearing and jumping during 180 s of exposure to a conditional context (without simulation such as tone or foot shock) revealed no significant genotype effect. There was no significant genotype effect (n = 35 mice). J Percentage of time spent exploring during 180 s of exposure to a conditional context (without simulation such as tone or foot shock). Cntn4-/- mice spent significantly more time exploring compared to Cntn4+/+ mice (p = 0.034, n = 35 mice). K Percentage of time spent scanning during 180 s of exposure to a conditional context (without simulation such as tone or foot shock) (n = 35 mice). L Average baseline plasma corticosterone levels (ng/ml) for each genotype. Both the Cntn4+/- and Cntn4-/- had significantly higher corticosterone levels than the Cntn4+/+ mice (p = 0.035 and p = 0.002, respectively; n = 31 mice). Bars represent the means, error bars indicate the standard error of mean (S.E.M.).

