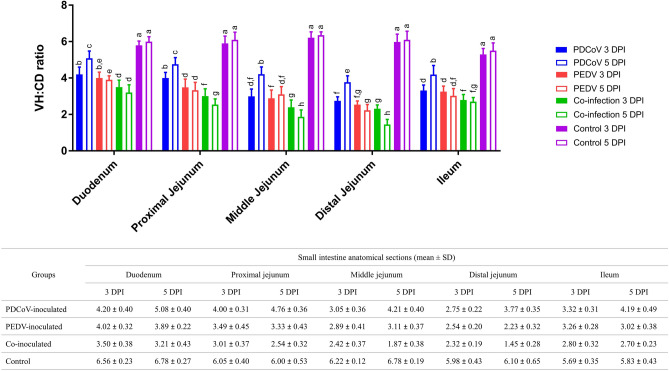
Figure 3.
Villous height and crypt depth (VH:CD) ratio in the duodenum, proximal jejunum, middle jejunum, distal jejunum, and ileum. Blue, red, green, and purple bars represent PDCoV-inoculated, PEDV-inoculated, co-inoculated, and control groups. Solid and open bars represent 3- and 5-days post-inoculation (dpi), respectively. Different lower-case letters indicate significant differences between each group, each dpi, and each anatomical section of the small intestine (p < 0.05). Values of mean ± standard deviation (SD) of each group, and each dpi are presented in a table under the graph.

