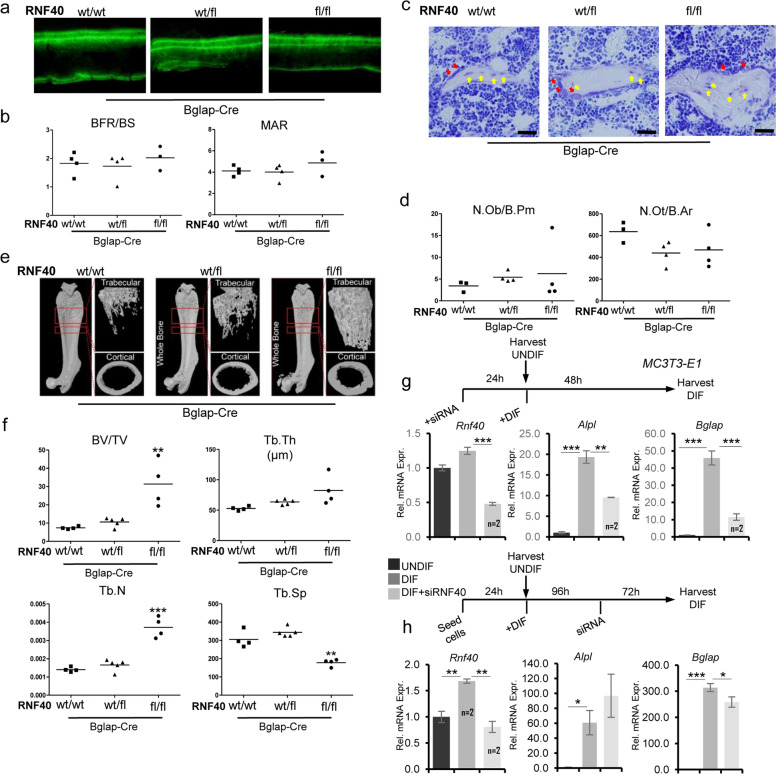
Fig. 3. RNF40 is dispensable in late-stage OBs.
a Representative fluorescent micrographs of femur cortical bone of 6-week-old from wild-type (wt/wt), heterozygous (wt/fl), and knockout (fl/fl) Rnf40Bglap-Cre male mice showing double calcein labeling. b Bone formation rate per bone surface area (BFR/BS) and mineral apposition rate (MAR) were quantified in conditional Rnf40Bglap-Cre male mice used in the study. c The plastic-embedded femoral sections from wild-type (wt/wt), heterozygous (wt/fl), and knockout (fl/fl) Rnf40Bglap-Cre 6-week-old male mice were subjected to toluidine blue stainings on trabecular bone. Red arrows: osteoblasts. Yellow arrows: osteocytes. Bar: 20 µm. d The number of osteoblasts per bone perimeter (N.Ob/B.Pm) and number of osteocytes per bone area (N.Ot/B.Ar) were evaluated via “osteomeasure.” Student’s t test was used for statistics where ***p < 0.001, **p < 0.01, *p < 0.05. e Representative µCT reconstruction pictures of the femur of conditional Rnf40Bglap-Cre male mice at 6 weeks of age. The bones were analyzed using a SkyScan 1176 microCT. f Bone histomorphometric parameters in conditional Rnf40Bglap-Cre mice showing trabecular bone volume/tissue volume (BV/TV), trabecular thickness (Tb.Th.), trabecular separation (Tb. Sp.), and trabecular number (Tb.N.) of femora of male mice used in the study were determined according to guidelines of the ASBMR Histomorphometry Nomenclature Committee. g, h The relative expression of osteoblast marker genes from MC3T3-E1 osteoblasts was evaluated via qRT-PCR analysis and normalized to the expression levels of the Gapdh housekeeping gene in the control undifferentiated state. In g, cells were transfected with siRNAs and after 24 h differentiation was induced. In h, Rnf40 was depleted 4 days after differentiation was initiated and the cells were cultured another 3 days in differentiation media. Mean ± SD, n = 3, unless otherwise indicated in the figure. One-way ANOVA followed by Bonferroni’s test was performed for statistical analysis where ***p < 0.001, **p < 0.01, *p < 0.05.

