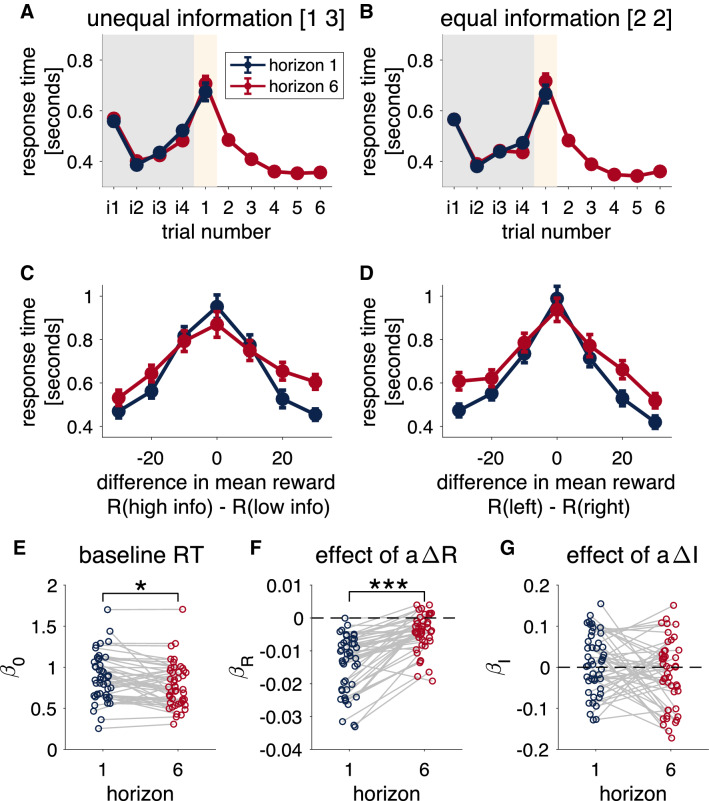
Figure 4.
Response times in the Horizon Task. (A,B) Average response time as a function of trial number for the unequal (A) and equal (B) information conditions. Instructed trials are labeled i1-4, free-choice trials 1–6. (C,D) Response time as a function of difference in mean observed reward in the unequal (C) and equal (D) information conditions. (E,F G) Linear regression analysis showing the baseline response time (E), and the effects of (F), and (G) on response times.

