Figure 1.
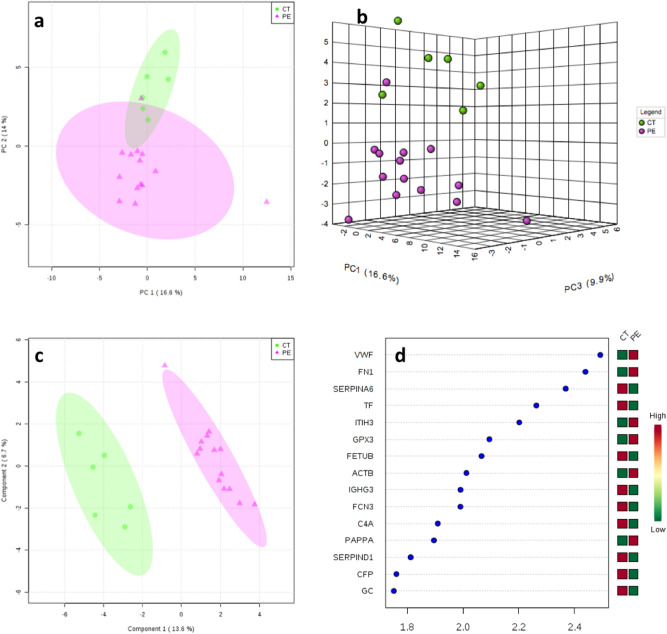
(a) 2-dimensional and (b) 3-dimensional principal component analysis (PCA) scores plots. (c) Partial least squares discriminant analysis (PLS-DA) scores plot between components 1 and 2. The explained variance is shown in brackets. Controls (CT) are presented in green circles and preeclampsia cases (PE) in violet triangles. (d) Top 15 most important proteins contributing to groups separation identified through PLS-DA ranked by variable importance in projection (VIP) scores. The right heatmap shows mean intensity variable in the respective group, with red and green indicating high and low protein levels, respectively. VWF Von Willebrand factor, FN1 fibronectin, SERPINA6 corticosteroid-binding globulin, TF serotransferrin, ITIH3 inter-alpha-trypsin inhibitor heavy chain H3, GPX3 glutathione peroxidase 3, FETUB FETUIN-B, ACTB actin, cytoplasmic 1, IGHG3 immunoglobulin heavy constant gamma 3, FCN3 ficolin-3, C4A complement C4-A, PAPPA pappalysin-1, SERPIND1 heparin cofactor 2, CFP properdin, GC vitamin D-binding protein.

