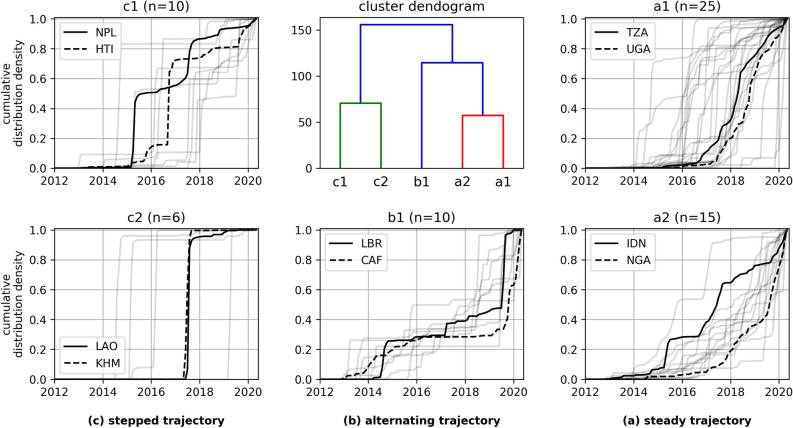
Figure 6.
Cluster dendogram and cumulative distribution density plots for monthly humanitarian OSM building mapping between 2012/01/01 and 2020/05/20. This plot depicts the values for all countries with medium and low human development index (SHDI<0.7). The groups are defined by a hierarchical clustering approach based on a distance matrix derived from dynamic time warping time series similarity analysis. For each group the trajectory for the two countries with highest overall mapping activity are highlighted. We used alpha-3 ISO 3166 codes to refer to the countries: TZA - Tanzania, UGA - Uganda, NPL - Nepal, HTI - Haiti, LAO - Laos, KHM - Cambodia, LBR - Liberia, CAF - Central African Republic, IDN - Indonesia, NGA - Nigeria. Created using Matplotlib 3.3. in Python 3.7.5 (https://www.python.org/).

