Figure 2.

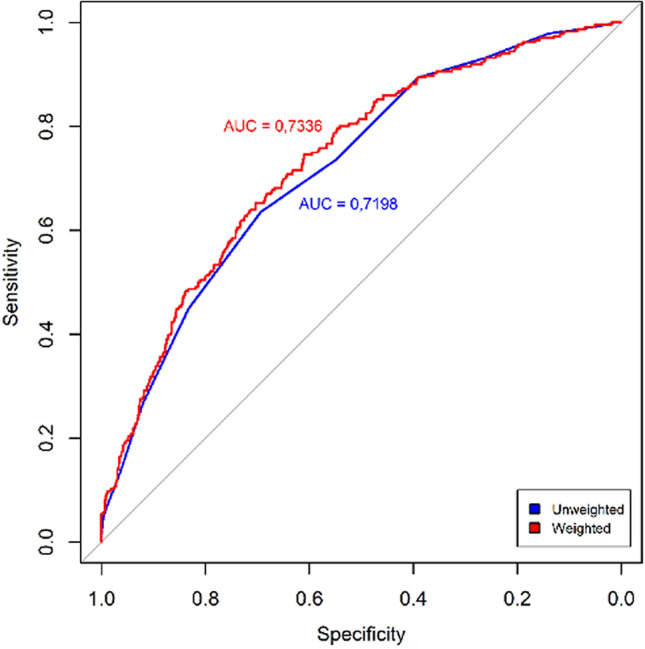
Receiver operating characteristics (ROC) curves of the two genetic risk scores, unweighted (uGRS) and weighted (wGRS). Areas under curves (AUC) are indicated. The straight line represents the ROC expected by chance only.

Receiver operating characteristics (ROC) curves of the two genetic risk scores, unweighted (uGRS) and weighted (wGRS). Areas under curves (AUC) are indicated. The straight line represents the ROC expected by chance only.