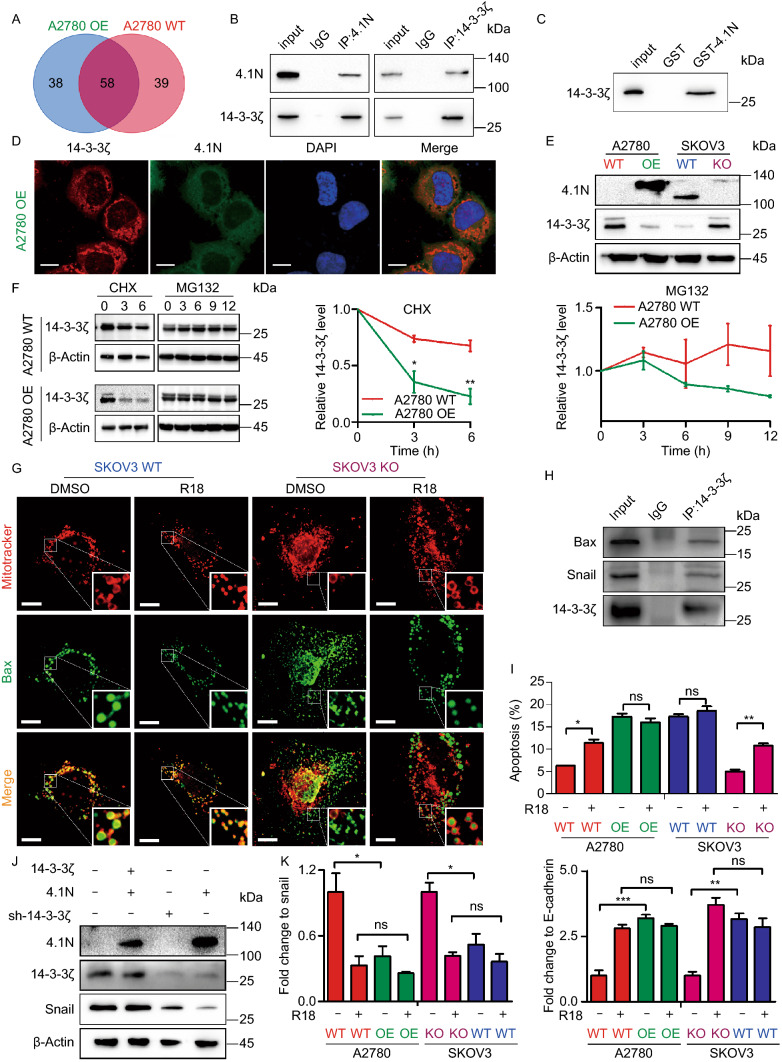
Figure 5.
4.1N negatively regulate 14-3-3 expression. (A) Veen diagram showing the interaction proteins of 4.1N in A2780 WT and A2780 OE cells using Co-IP/MS, then, we use Co-IP assay (B) and GST-Pulldown assay (C) to validated. (D) Subcellular localization of 4.1N, 14-3-3ζ and DAPI in A2780 OE cells. Scale bar, 10 µm. (E) Western blot assay detected the protein expression effect of 4.1N on 14-3-3ζ. β-Actin was used to serve as a loading control. (F) 14-3-3ζ protein expression in A2780 WT and A2780 OE cells was determined with western blot analysis following treatment with the translation inhibitor CHX for 0, 3, 6 h and the proteasome inhibitor MG‐132 for 0, 3, 6, 9, 12 h. β-Actin was used to serve as a loading control. (G) The co-staining of mitochondria and Bax. In the enlarge panel, the yellow fluorescence is the foci of mitochondria and Bax, indicative of apoptosis activation. The loss of 4.1N could limit the overlap of mitochondria and Bax, however, R18 can reverse it. Scale bar, 10 µm. (H) Co-IP assay of 14-3-3ζ by agarose beads followed by Western blot with indicated antibodies. (I) Flow cytometer assay was used to quantify R18 effect on cellular apoptosis. (J) Effects of 4.1N and 14-3-3ζ on snail proteins was assayed by Western blot. β-Actin was used to serve as a loading control. (K) qRT-PCR assay was used to quantify R18 effect on EMT-related mRNA expression and results means ± SD from three independent experiments. β-Actin was used as internal control

