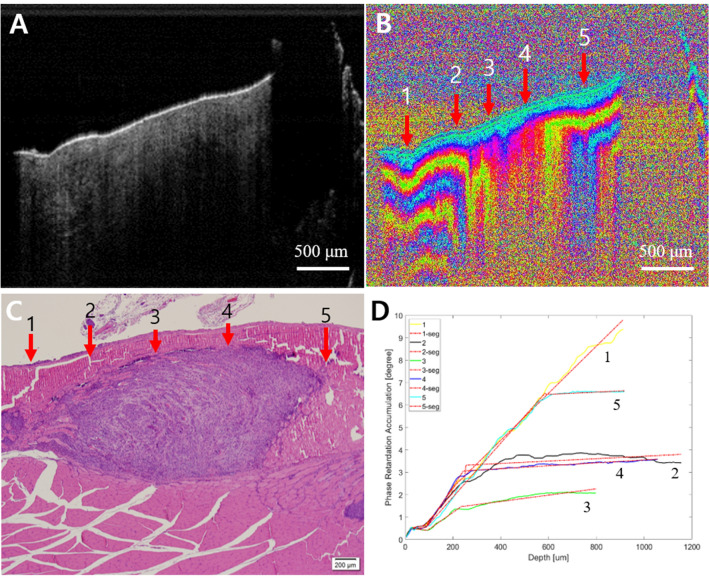
Fig. 6.
Early cancer. A Intensity OCT image, B PS-OCT image, 1–5 are selected A-lines for phase retardation analysis (1 and 5: normal-looking, 2 and 4: transition, and 3: lesion), C pathology, and D phase retardation accumulation graph. In the PS-OCT image, 2–4 showed the collapsed structure by the tumor. It also showed the tumor in pathology. In the graph, 2–4 have relatively lower phase retardation than 1 or 5

