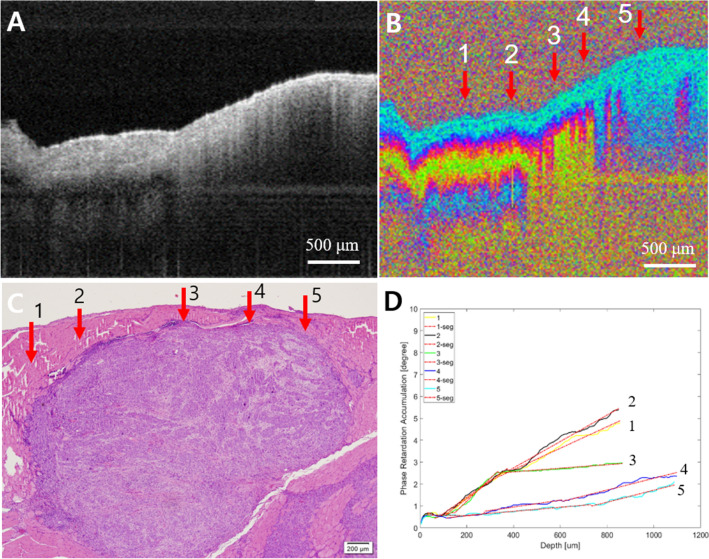
Fig. 8.
Advanced cancer. A Intensity OCT image, B PS-OCT image, 1–5 are selected A-lines for phase retardation analysis (1: normal-looking, 2 and 3: transition, and 4 and 5: lesion), C pathology, D phase retardation accumulation graph. The intensity OCT and the PS-OCT images showed a completely collapsed structure by the tumor overgrown enough to get close to the surface of the tissue, as 4 and 5 in pathology. The graph showed low phase retardation, especially at 4 and 5

