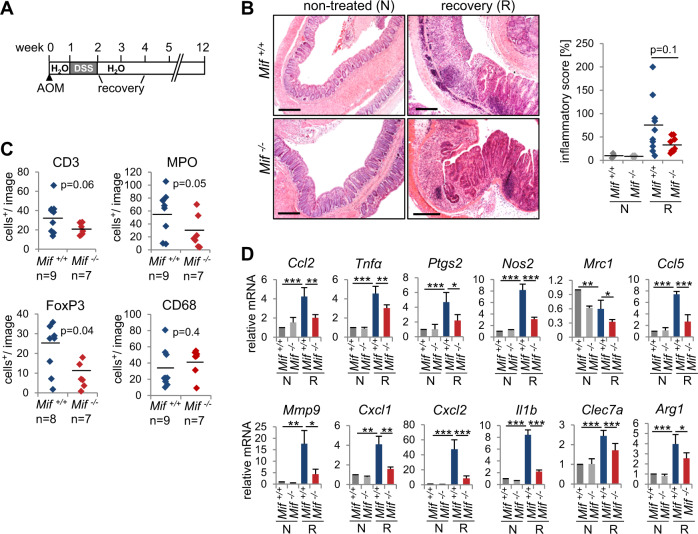
Fig. 3. A Mif deletion protects mice from inflammation-associated cancer initiation.
A Schematic of the AOM/DSS mouse model. CRC was initiated by a single AOM injection, followed by one cycle of DSS administration. At 8 days of post-DSS treatment, mice were analyzed for recovery. B Representative H&E staining of colonic tissues from the indicated mice 8 days post-DSS (recovery = ‘R’) or from untreated control mice (‘N’). Scale bars, 300 µm. (Right) The ‘inflammatory score’ was assessed based on tissue morphology and immune cell infiltration. (Left) Nontreated mice, n = 3/group; recovery Mif+/+ mice, n = 10, Mif−/− mice, n = 8. Black lines, mean. p values were calculated with ANOVA Bonferroni’s multiple comparison test; p = 0.0455. Indicated groups, calculated with Student’s t test. C Quantification of the indicated histological staining of colonic tissues 8 days post-DSS (‘recovery’) in Mif+/+ and Mif−/− mice. n, mouse numbers. Five to seven images (area = ×40 magnification) per mouse were analyzed for positively stained stromal cells. Black lines, mean. D mRNA levels of inflammatory genes in recovering (‘R’) and nontreated (‘N’) colonic tissues. Single samples from the indicated genotypes/groups were pooled (nontreated, n ≥ 3; recovering tissue, n ≥ 4). qRT-PCR was performed, and the expression levels were normalized to those of Rplp0 mRNA. Means ± SD of ≥3 technical replicates/pools, each pipetted. C, D p values were calculated with Student’s t test comparing the indicated groups. *p ≤ 0.05, **p ≤ 0.01, ***p ≤ 0.001.

