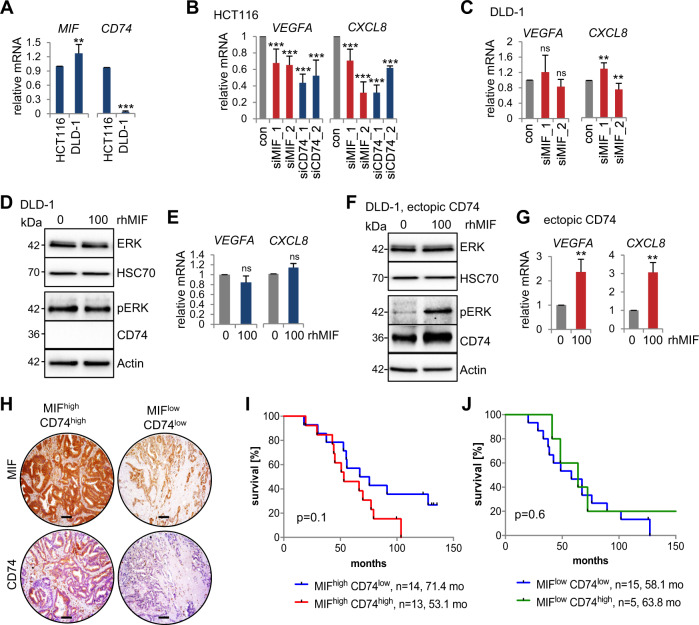
Fig. 5. The CD74-MIF receptor interaction facilitates the expression of angiogenic factors in CRC cells.
A qRT-PCR analysis of the relative mRNA levels of MIF and CD74 in HCT116 and DLD-1 CRC cells. Normalized to those of RPLP0. Means ± SD of 2 biological replicates with 3 technical replicates each. B, C Expression analysis of the indicated angiogenic genes in HCT116 (B) or DLD-1 (C) cells after siRNA-mediated knockdown of MIF or CD74 for 72 h; a scrambled siRNA served as the control (‘con’). qRT-PCR were normalized to HPRT1 or RPLP0, respectively. Means ± SD of ≥3 technical replicates from two biological replicates. D, F Angiogenic pathway analysis in CD74-deficient DLD-1 cells. 48 h after DLD-1 cells were transfected with an empty control (D) or CD74 overexpression plasmid (F), they were treated with 100 ng/mL recombinant human MIF (rhMIF) for 24 h. Immunoblots of CD74, pERK, and total ERK. Actin and Hsc70, loading controls. E, G Angiogenic marker expression (VEGFA, CXCL8). DLD-1 cells were treated as described in (D, F) followed by qRT-PCR. Expression of the indicated genes was normalized to that of RPLP0. Means ± SD of ≥3 technical replicates. H Representative images of serial sections from two human CRC patients stained for MIF and CD74 with different stabilization of MIF (MIFhigh: stabilized, MIFlow: unstabilized) and expression levels of CD74 (CD74high, CD74low). Scale bars, 200 µm. I, J Correlation between patients with stabilized MIF (MIFhigh) and CD74 levels (CD74high, CD74low) (I) and patients with unstabilized MIF (MIFlow) and CD74 levels (CD74high, CD74low) (J) on overall survival of patients. Log-rank (Mantel-Cox) test for comparison of indicated groups. A, B, C, E, G p values were calculated with Student’s t tests for comparison of indicated groups; ns = not significant, *p ≤ 0.05, **p ≤ 0.01, ***p ≤ 0.001.

