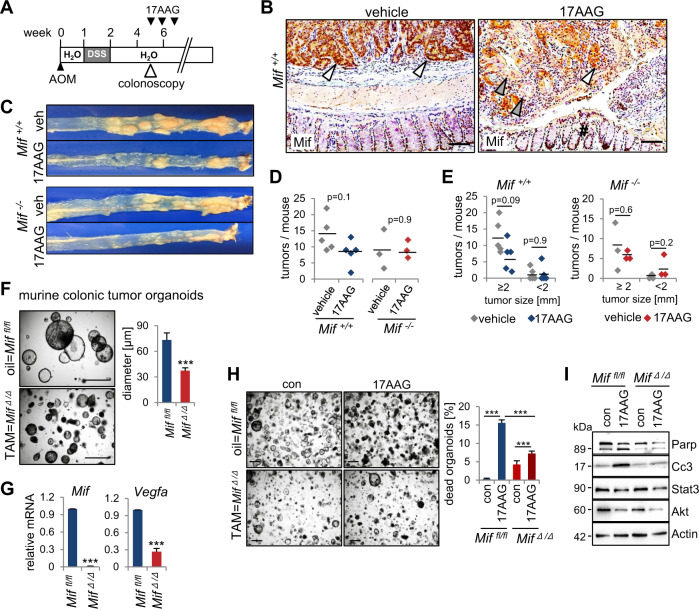
Fig. 6. MIF-driven CRC is vulnerable to Hsp90 inhibition.
A Hsp90 inhibitor treatment timeline within the AOM/DSS mouse model. After tumors visualized via colonoscopy and scored as more than one S2/3 or three S1/2 tumors, mice were treated with the HSP90 inhibitor 17AAG for 3 weeks. B Representative histological Mif staining of tumor-bearing colonic tissue from Mif+/+ mice after 3 weeks of 17AAG or vehicle treatment. White arrows indicate tumor epithelial cells with elevated Mif levels. Gray arrows indicate tumor cells with degraded Mif. #, normal epithelia of the next surrounding layer with low Mif levels. Scale bars, 100 µm. C Macroscopic overview of entire tumor-bearing colons from Mif+/+ and Mif−/− mice after 3 weeks of treatment with 17AAG or vehicle. D Numbers of tumors per mouse as indicated in Mif+/+ (n = 5 mice per group) and Mif−/− mice (n = 3 per group). Black lines, mean. p values with ANOVA, Bonferroni’s multiple comparison test, p = 0.212. E Tumor sizes of mice from (D). Indicated groups, calculated with Student’s t test. F Assessment of organoid growth in Mif-depleted organoids. Miffl/fl;villincreERT2 mice with a defined tumor burden were treated with Tamoxifen (TAM) or respective vehicle control to generate Mif-deficient CRC tumors (Mif∆/∆) to mimic a Mif epithelial-specific knockout. From those tumors, colonic tumor organoids were generated. Representative images and quantification of colonic tumor organoids (p 5) derived from oil (Miffl/fl) or TAM (Mif∆/∆) treated mice. (right) At least 11 images were quantified from 10 different gel domes. Diameter of organoids was measured using ImageJ. Scale bars, 200 µm. Means ± SD from different images. G Expression analysis of Mif and Vegfa in Miffl/fl or Mif∆/∆ derived organoids. Via qRT-PCR, expression was co-normalized to Rplp0 and Hprt1. Means ± SD of 4–5 technical replicates. H Imaging and quantification of organoid death of Mif-proficient (top) and Mif-deficient (bottom) organoids prepared as in (F) after 17AAG (500 nM) for 21 h. Scale bars, 200 µm. Quantifications based on organoid morphology. At least 5 images from ≥5 gel domes (×4 magnification each) per group were counted. The percentage of dead organoids was calculated to all organoids. Mean ± SD from ≥6 images. I Immunoblot of organoids of (H) at the endpoint of the experiment. Cc3 (cleaved caspase-3) and Parp (poly(ADP-ribose)-polymerase), apoptotic markers. Stat3 and Akt, further Hsp90 clients served as positive control for 17AAG functionality. Actin, loading control. F, G, H p values, Student’s t tests for indicated groups.

