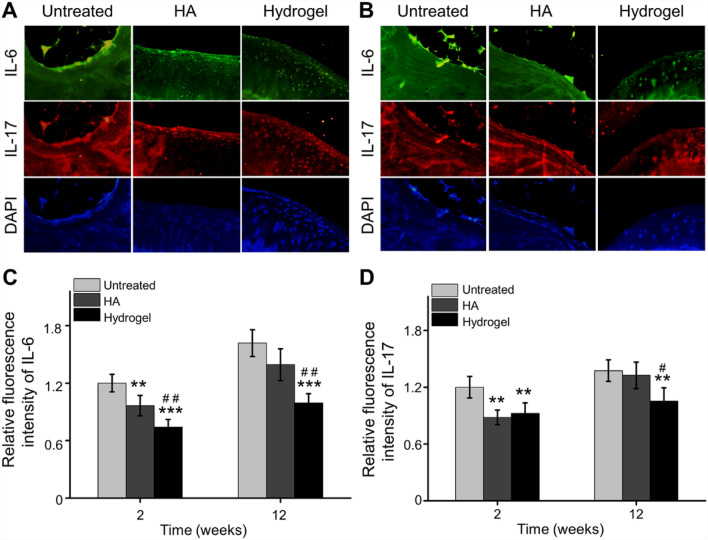
Fig. 6.
Inhibited inflammatory cytokines expression in cartilage. A Representative immunofluorescence images of IL-6 and IL-17 expression in cartilage at 2 weeks post-injection. B Representative immunofluorescence images of IL-6 and IL-17 expression in cartilage at 12 weeks post-injection. C Quantitative analysis of IL-6 expression in cartilage at 2 weeks and 12 weeks post-injection. D Quantitative calculation of IL-17 expression in cartilage at 2 weeks and 12 weeks post-injection (**p < 0.01, ***p < 0.001 compared with the Untreated group; #p < 0.05, ##p < 0.01 compared with the HA group)

