Figure 3.
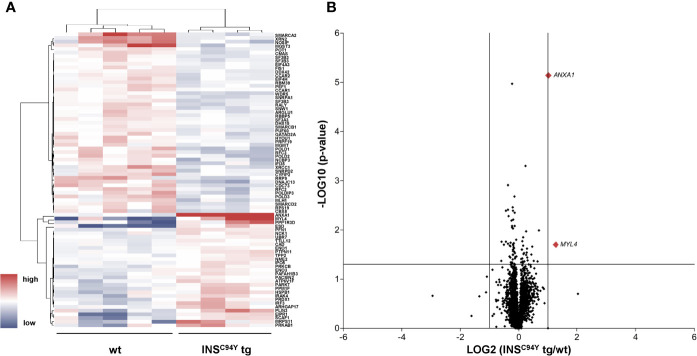
Quantitative proteome analyses of porcine CD4+ T cells. (A) Hierarchical cluster analysis of the porcine CD4+ T cell proteome revealed significant differences in protein abundance (p < 0.05) in INSC94Y tg pigs (n=4) and non-transgenic littermates (wt, n=5) indicated by their human orthologue gene names. Red color indicates increased and blue color decreased abundances of the identified proteins. (B) Volcano plot illustrates quantified proteins (≥ 2 unique peptides) in CD4+ T cells of INSC94Y tg pigs and wild-types (wt). Log2 abundance differences between groups (x-axis) are plotted against Log10 statistical significance values (y-axis). The horizontal line indicates the p-value cut-off at 0.05, the vertical line shows ratio cut-off at 2. The two proteins that satisfied the biological (ratio ≥ 2) and statistical (p < 0.05) significance threshold are shown in red (MYL4 and ANXA1).

