Figure 5.
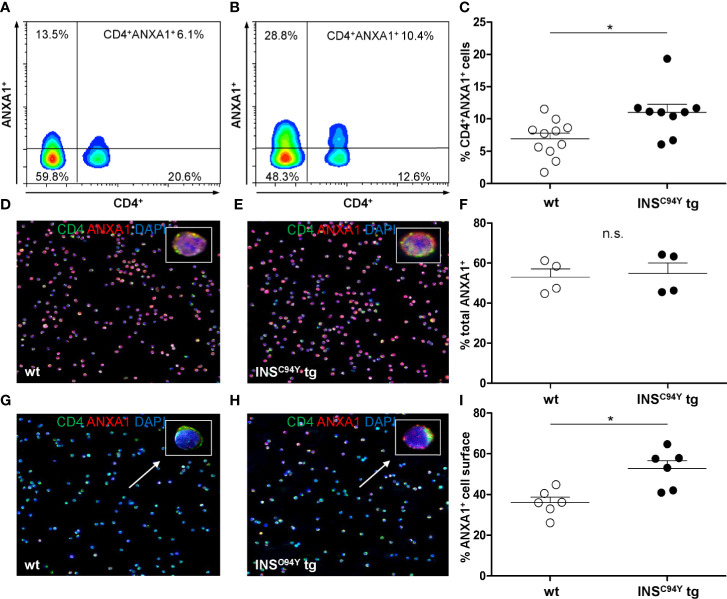
Differential ANXA1 expression in porcine CD4+ T cells. (A–C) Representative flow cytometric images of ANXA1+CD4+ T cells of a wild-type (A) and an INSC94Y tg pig (B) are shown with reduced ANXA1 expression in wild-type CD4+ T cells. (C) Scatter plots summarizing flow cytometry analyses of PBMC of eleven wild-type and nine INSC94Y tg pigs. ANXA1 was significantly elevated in CD4+ T cells of INSC94Y tg pigs (*p < 0.05). (D–F) Similar ANXA1 levels after permeabilization in purified CD4+ T cells of a wild-type (D) and an INSC94Y tg pig (E) shown by immunofluorescence staining for ANXA1 (red), CD4 (green) and nucleus (blue, counterstained with DAPI) and confirmed by flow cytometry using n=4 per group (F). (G–I) Representative images of immunofluorescence staining for ANXA1 on the outer cell membrane of porcine CD4+ T cells demonstrate higher ANXA1 expression in CD4+ T cells of the INSC94Y tg pig (H) compared to the wild-type (G) (arrows). (I) A higher ANXA1 expression on the cell surface of diabetic CD4+ T cells compared to CD4+ T cells of wild-types was confirmed by flow cytometry (n=6 per group). Horizontal bars indicate group means.

