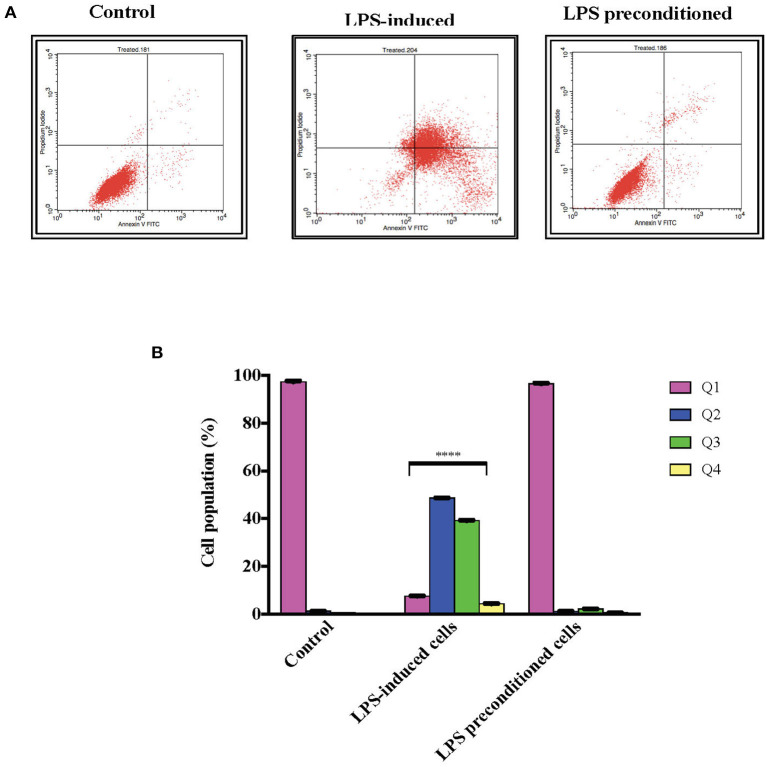
Figure 12.
Quantitative analysis of apoptosis progression within population in LPS-preconditioned cells by using flow cytometry. Annexin V-FITC and PI staining of the LPS-induced and LPS-preconditioned cells at the indicated time point earlier measured by flow cytometry. (A). There is a distinct and gradual cell population shift from the lower left quadrant to the lower right, upper right, and upper left, indicating a gradual increment of cells with exposed phosphatidylserine. Q1 is the Annexin V-FITC–/PI– quadrant (intact cells), Q2 is the Annexin V-FITC+/PI– quadrant (early apoptotic cells), Q3 is the Annexin V-FITC+/PI+ quadrant (late apoptotic cells), and Q4 is the Annexin V-FITC–/PI– quadrant (dead cells). Bars represent mean data ± S.E.M from three independent experiments. (B). Data were analyzed using one-way ANOVA, followed by a Bonferroni post-hoc test. Percentage of LPS-stimulated cells was compared to the control. ****p < 0.0001 considered to be statistically significant.

