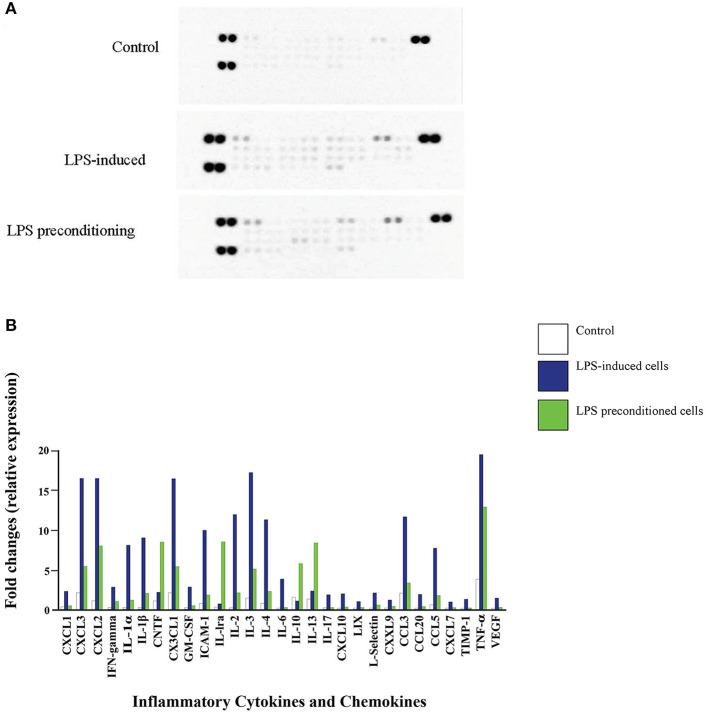
Figure 14.
Quantitative analysis of inflammatory cytokines and chemokines. (A) The Rat Cytokine Array detects multiple analytes in LPS- induced cells, LPS-preconditioned cells, and control cells. Spot densities were analyzed by scanning the membrane on a Biospectrum AC ChemiHR 40 densitometer, and data were normalized to control and expressed as fold change relative to the control. (B) Quantitative analysis in the arrays showed differences in cytokine and chemokine expression in LPS-induced cells, LPS-preconditioned cells, and control cells. Each experiment was performed in duplicate.

