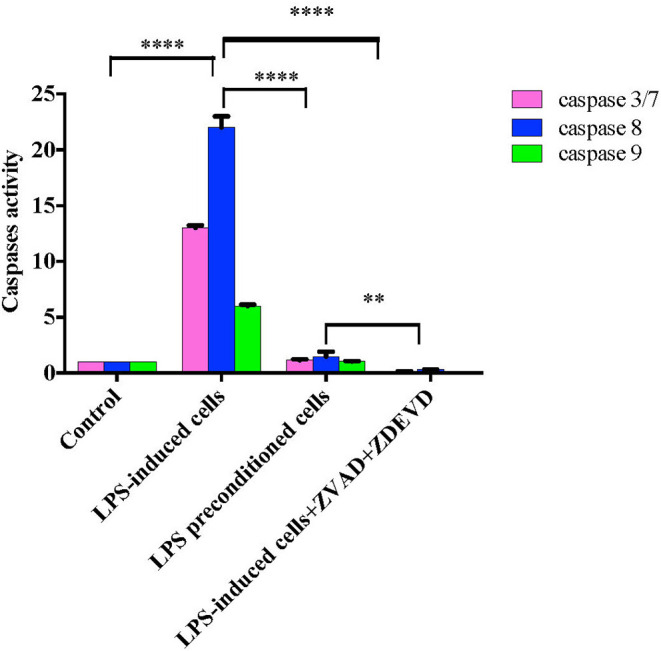
Figure 18.

Caspase activity in intrinsic and extrinsic apoptosis pathway. Fold changes in caspase 3/7, caspase-8, and caspase-9 activities in LPS-induced cells, LPS-preconditioned cells, and LPS-induced cells with caspase inhibitors compared to control cells based on the relative luminescence units generated through the cleavage of substrate after treatment. Data were analyzed using two-way ANOVA, followed by a Bonferroni post-hoc test, **p < 0.01 ****p < 0.0001 vs. control cells. Data are expressed as mean ± S.E.M of three independent experiments.
