
Figure 19.
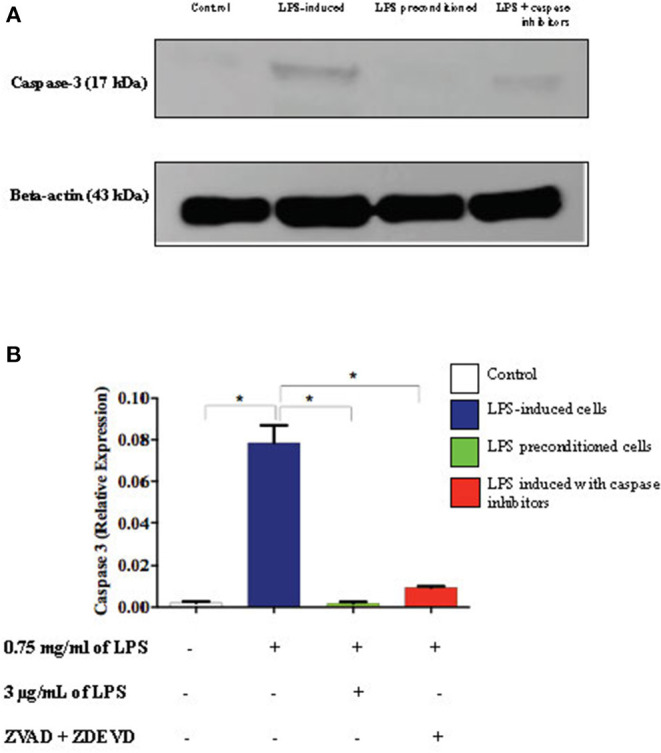
Expressions of caspase-3. (A) The expressions of caspase-3 was determined in whole cell lysates by western blotting. Band densities were measured by densitometric analysis, and data were normalized to the control and expressed as fold change relative to beta-actin. (B) Bars represent data from three independent experiments. Caspase-3 expressions in LPS-induced cells, LPS-pre-conditioned cells, and LPS-induced cells with caspase inhibitors were compared to the control. *p < 0.05, as determined by one-way ANOVA with Bonferroni's correction.