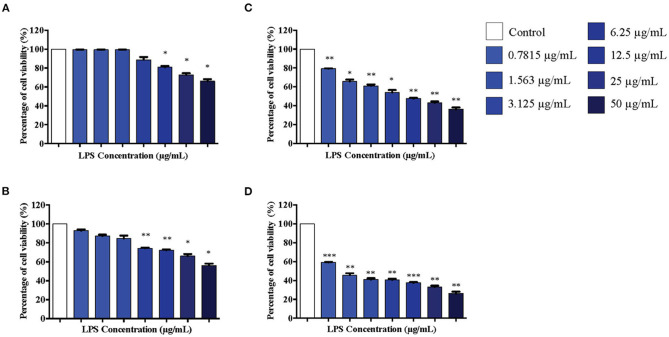
Figure 2.
The differentiated PC12 cells were exposed to 50, 25, 12.5, 6.25, 3.125, 1.563, and 0.7815 μg/mL LPS for (A). 12, (B). 24, (C). 48, and (D). 72 h. Cell viability was determined by MTT assay. Bars represent mean data ± S.E.M from three independent experiments. Data were analyzed using one-way ANOVA, followed by a Bonferroni post-hoc test. Percentage of cell viability of LPS-stimulated cells was compared to control. *p < 0.05, **p < 0.01, ***p < 0.001 considered to be statistically significant.

