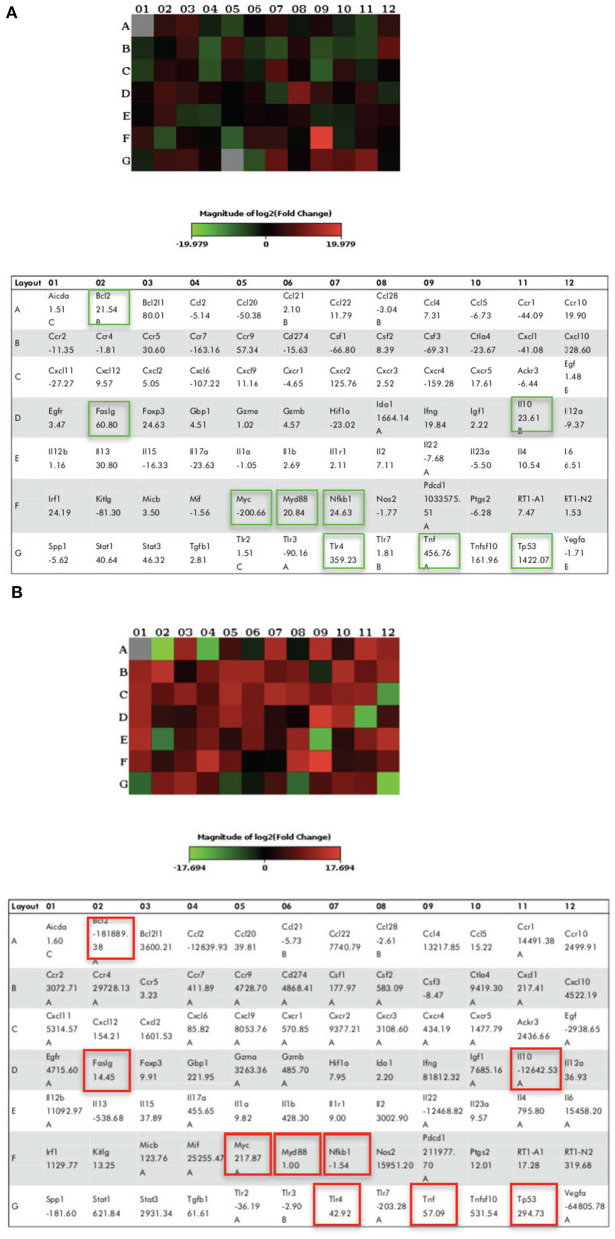
Figure 23.
The Heat Map array provides visualization of fold changes in expression. (A) The fold changes in expression between LPS-induced and LPS-preconditioned cells (in green) for every gene in the array in the context of the array layout of three independent experiments. (B) The fold changes in expression between LPS-induced cells and LPS-induced cells with caspase inhibitors (in red) for every gene in the array in the context of the array layout of three independent experiments. The table provides the fold regulation data used for the map.

