
Figure 5.
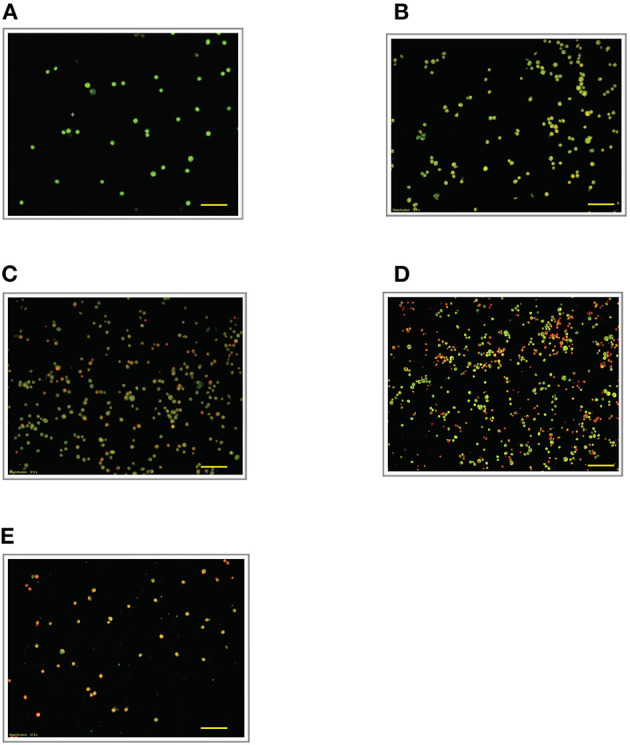
Acridine orange and propidium iodide nucleic acid binding dyes in LPS-stimulated cells. Cells were stimulated with 6 μg/mL LPS for (A). Control, (B). 12, (C). 24, (D). 48, and (E). 72 h. Cells were stained with AO/PI to examine their morphological changes, where the green color represents AO, which stains live and dead nucleated cells while the red color represents PI, which stains dead nucleated cells. Representative fluorescence images from inverted fluorescence microscope. Field of views for each time point from three independent experiments. The cells lost membrane integrity with yellow to orange color change, indicating pre-early and early apoptosis. Pictomicrographs were taken with original magnification (10×); the scale bar represents 100 μm.