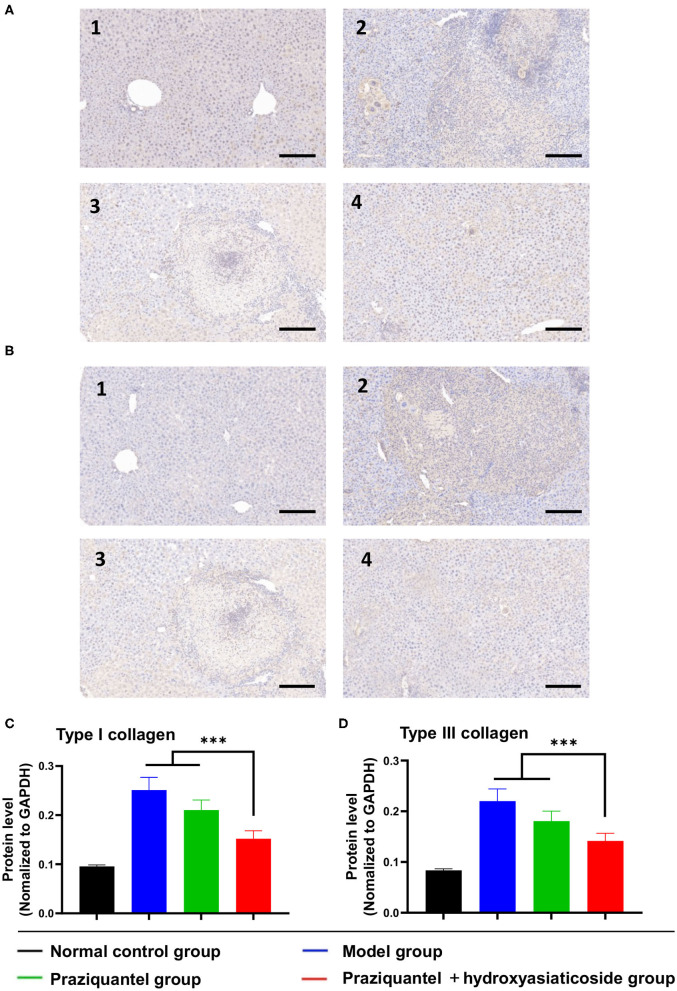
Figure 4.
Immunohistochemistry analysis of the expression levels of type I (A) and III (B) collagen in liver tissues. Scale bar: 200 μm. Quantitative detection of the expression levels of type I (C) and III (D) collagen among different groups. 1: normal control group; 2: model group; 3: praziquantel group; 4: praziquantel + hydroxyasiaticoside group. ***p < 0.001.

