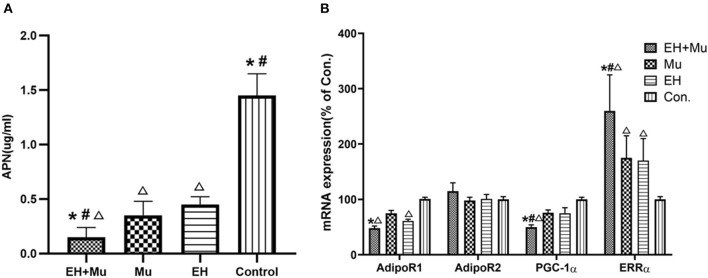
Figure 4.
Plasma APN and expression of APN-related molecules. (A) The plasma APN levels of patients with or without tRNA 15910 C>T and/or EH (*P < 0.05 vs. Mu group; #P < 0.05 vs. EH group; ΔP < 0.05 vs. control group); (B) The mRNA levels of APN-related molecules in each group. (*P < 0.05 vs. Mu group; #P < 0.05 vs. EH group; ΔP < 0.05 vs. control group).

