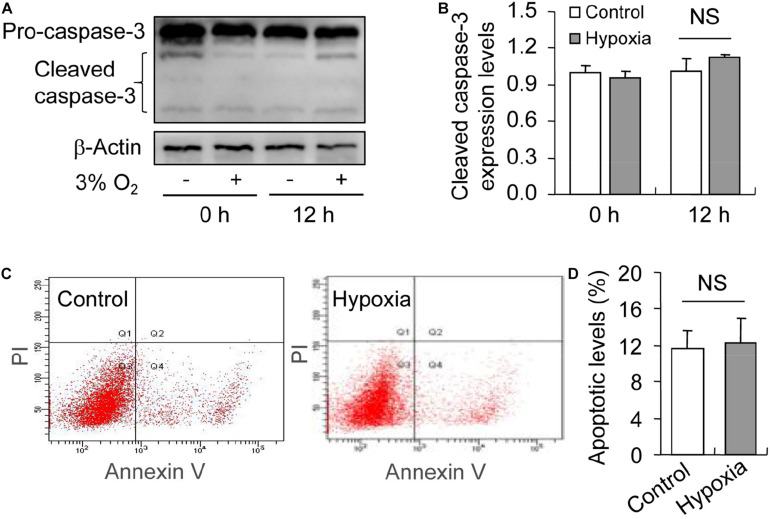
FIGURE 7.
Effect of hypoxia on apoptosis of GCs cultured in vitro. GCs were cultured in vitro with and without hypoxia, and then apoptosis was examined. (A) Representative immunoblotting of caspase-3. (B) Densitometric quantification of cleaved caspase-3. (C) Representative images of flow cytometry using Annexin V-PI staining. (D) Percentages of GC apoptosis. Each value represents the mean ± SE. One-way analysis of variance (ANOVA) was used to analyze the data, followed by a Tukey’s multiple range test. N = 6. NS, no significance.

