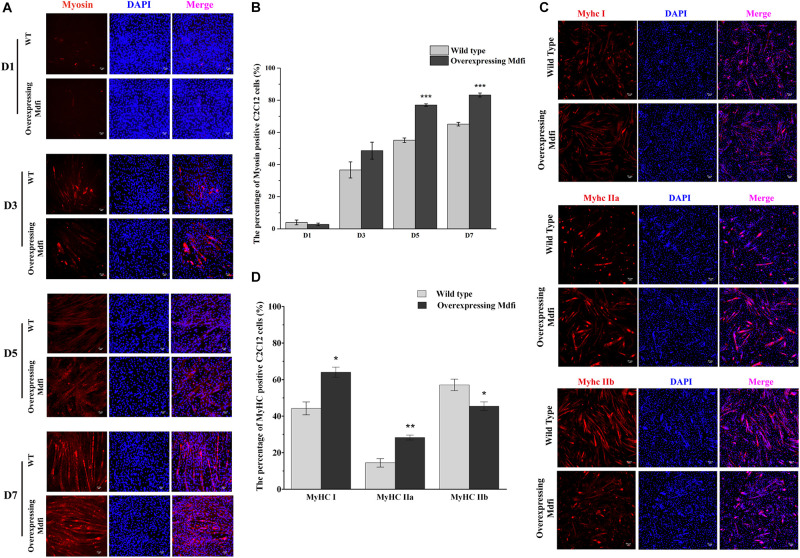
FIGURE 3.
Characteristics of differentiation and muscle fiber types in C2C12 cells with Mdfi overexpression. (A) Representative images of differentiating wild-type and overexpressing Mdfi C2C12 cells on days 1, 3, 5, and 7 in white light or myosin immunofluorescent staining. Myosin: red, a molecular marker of myogenesis; DAPI: blue, cell nuclei; Merge: the C2C12 cells fused into primary myotubes are shown in the insets. (B) Quantitative diagram of the percentage of myosin-positive C2C12 cells. (C) MyHC I, MyHC IIa, and MyHC IIb immunofluorescence staining in WT and Mdfi-OE C2C12 cells, respectively. (D) Quantitative diagram of the percentage of MyHC I, MyHC IIa, and MyHC IIb-positive C2C12 cells. The results are presented as Mean ± SEM of three replicates for each group. Magnification 200×. The scale bar on the photomicrographs represents 25 μm.

