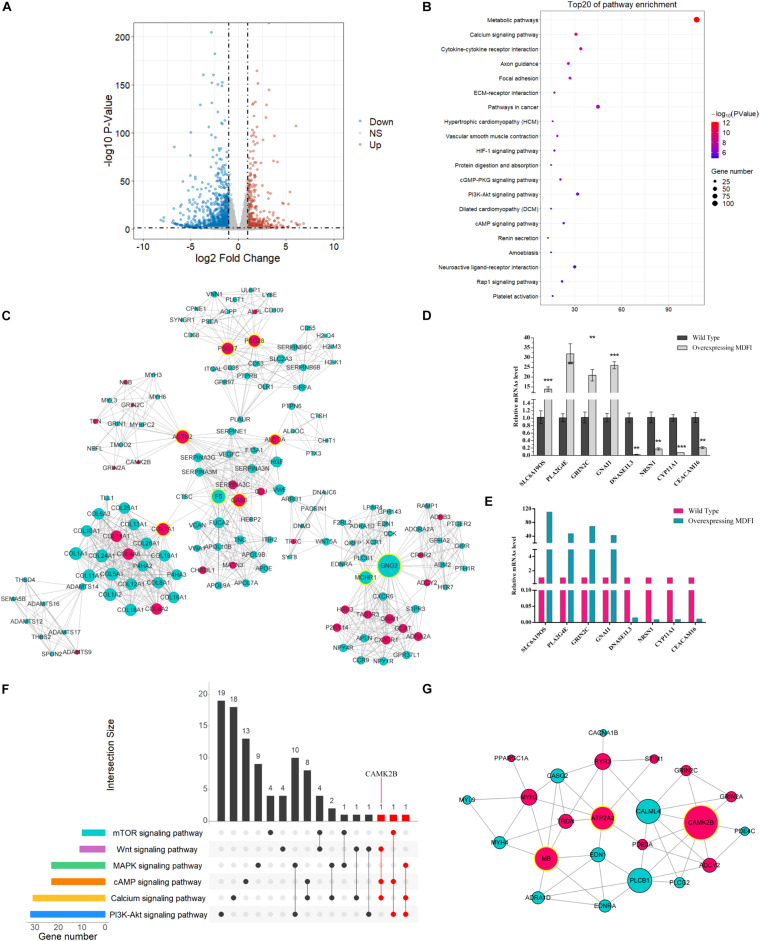
FIGURE 4.
RNA-seq analysis in Mdfi-OE vs. WT C2C12 cells. (A) The Volcano plot displays an overview of the DEGs. The X-axis represents the log-transformed P-value, and the Y-axis indicates the multiple of the DEGs. The gray dots represent DEGs that are not differentially expressed, the red dots represent the upregulated DEGs, and the blue dots represent the downregulated DEGs. |Log2FoldChange| > 1 and p < 0.05 were set as the criteria. (B) The first twenty pathways of the DEGs. The X-axis represents the number of DEGs enriched in the pathway. (C) PPI network in Mdfi-OE vs. WT. The network displays gene interactions. Nodes represent genes, and edges represent gene interactions. The upregulated genes are shown in red, downregulated genes are shown in green, and hub genes are shown in yellow. (D) qPCR validated of DEGs. (E) Expression levels of DEGs in RNA-seq. **p < 0.01, ***p < 0.001. (F) The upset plot of the intersection of each pathway. The transverse bar graph at the bottom left shows the number of genes enriched in each pathway. The black points in the dot matrix at the bottom left and in the bar graph at the top indicate genes included in the pathways. The bars above represent the number of genes corresponding to each intersection. The red bars represent the number of intersection genes enriched in three or more pathways (n ≥ 3). (G) The gene network displayed the gene interactions and was generated by Cytoscape (version 3.6). Nodes represent genes, and edges represent gene interactions. The upregulated genes are shown in red, downregulated genes are shown in green, and hub genes are shown in yellow.

