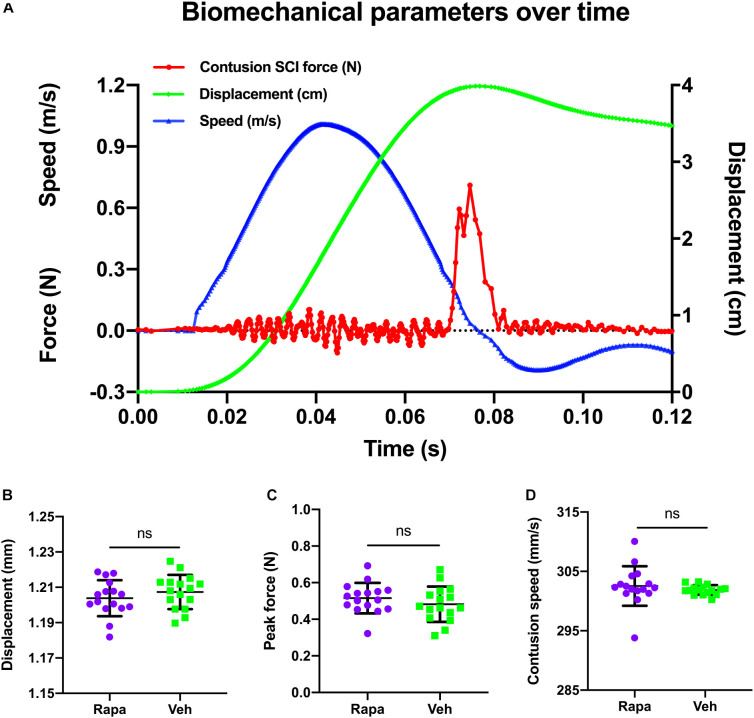
FIGURE 1.
A representative graph of the changes of biomechanical parameters during contusion and their comparison in different groups. (A) Changes in biomechanical parameters over time. Red, contusion force; green, contusion displacement; blue, contusion speed. (B–D) There were no significant differences between the two injured groups in contusion displacement, contusion speed, and peak force. m/s, meters per second; N, newton; cm, centimeter; s, seconds; mm, millimeters; mm/s, millimeters per second. Rapa, the rapamycin-treated group; Veh, the vehicle-treated group. nsP > 0.05. Error bars are mean ± SEM.

