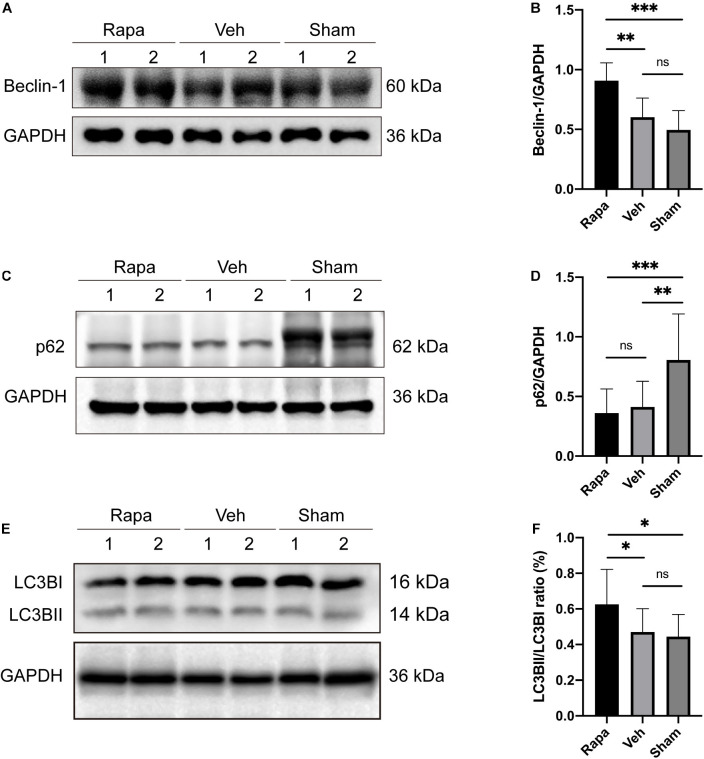
FIGURE 2.
The representative Western blot images and the histogram showed the relative expression of Beclin-1, LC3BII, and p62. Representative Western blots and quantitative graphs demonstrate that the expression of Beclin-1 in the rapamycin-treated group was significantly greater than that in the vehicle and sham groups (A,B), the expression of p62 decreased significantly in the two injured groups compared with the sham group after spinal cord injury (SCI) (C,D), and the expression of LC3BII in the rapamycin group was significantly greater than that in the vehicle and sham groups (E,F). Rapa, the rapamycin group; Veh, The vehicle group; Sham, the sham group. ∗P < 0.05, ∗∗P < 0.01, ∗∗∗P < 0.001, nsP > 0.05. Error bars are mean ± SEM.

