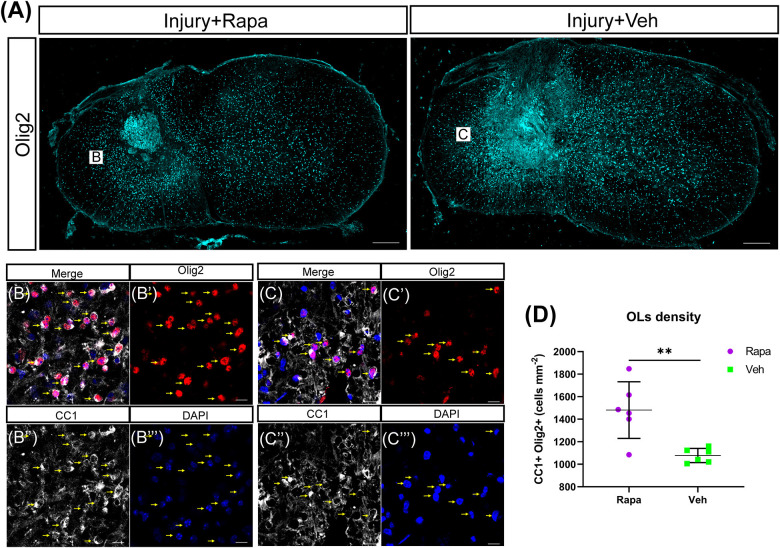
FIGURE 6.
The number of oligodendrocytes (OLs) was increased in the rapamycin-treated mice at 12 weeks post-injury. (A) Overview of Olig2 staining at injury epicenter in the rapamycin-treated and vehicle-treated groups. Boxes are approximate areas where (B,C) were imaged. (B,C) High-magnification representative images of the lateral white matter stained with Olig2 and CC1 in the rapamycin-treated and vehicle-treated mice. Yellow arrows in (B,C) indicate OLs. (D) Quantification demonstrates that the rapamycin-treated mice have a higher density of OLs (Olig2 + CC1 +) than the vehicle-treated mice. Rapa, the rapamycin group; Veh, the vehicle group. ∗∗P < 0.01. Scale bars = 200 μm (A) and 10 μm (B,C). Error bars are mean ± SEM.

