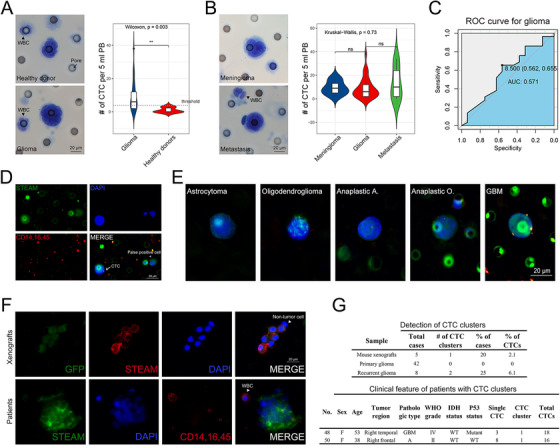
FIGURE 4.

Supplemental information. A, Left panel: representative image of Wright's staining positive cells isolated from healthy donors (upper panel) and patients with glioma (lower panel). Scale bar = 20 μm. Right panel: quantification of Wright's staining positive CTCs in blood samples drawn from healthy donors (n = 6) and glioma patients (n = 29) (P < .01). Threshold: 4 Wright's staining positive cells per 10 ml PB. B, Left panel: representative image of Wright's staining positive cells isolated from patients with meningioma (upper panel) and metastasis (lower panel). Scale bar = 20 μm. Right panel: quantification of Wright's staining positive cells in blood samples drawn from patients with glioma (n = 29), meningioma (n = 9), and metastasis (n = 7) (P > .05). C, ROC curve analysis revealed that the level of Wright's staining positive CTC was not a good predictor of glioma (AUC = 0.571). D, Representative image for CTC and false positive cells by modified STEAM staining. Left cell: a STEAM‐positive CTC. Right: a false positive cell. Scale bar = 20 μm. The criteria for glioma CTC include: STEAM+/DAPI+/CD45−, nuclei larger than a 2‐calibrated pore size (8 μm) (ie. > 16 μm), irregular nuclei, and a high nuclear/cytoplasmic ratio. E, Representative image of five different pathological subtypes of glioma. Scale bar = 20 μm. F, Upper panel: representative image of CTC clusters isolated from mouse xenografts. Lower panel: representative image of CTC clusters isolated from glioma patients. Scale bar = 20 μm. G, Upper panel: quantification of detectable CTC clusters in xenografts (n = 5), primary glioma (n = 42), and recurrent glioma (n = 8). Lower panel: clinical feature of patients who had CTC clusters. A: astrocytoma; O: oligodendroglioma. GBM: glioblastoma multiforme
