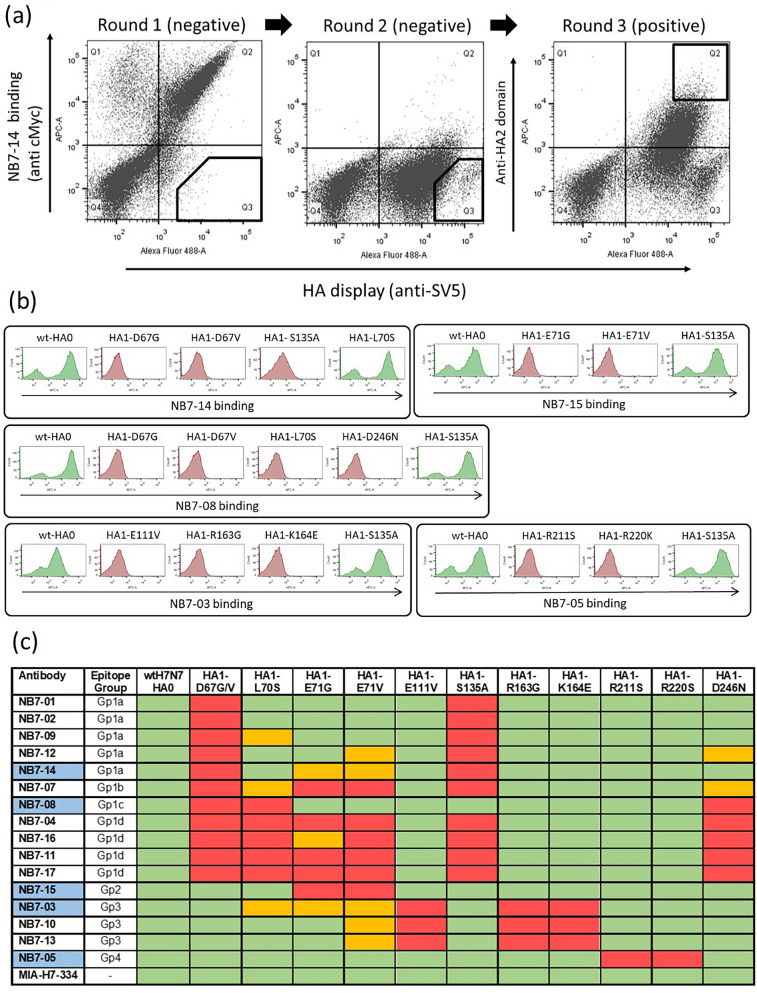
Figure 3.
Epitope footprints of H7-HA specific nanobodies. (a) Example selection campaign for NB7-14 showing two rounds of ‘negative’ selection followed by a third round of ‘positive’ selection. (b) Flow cytometry histograms (FlowJo 10.4 software) showing Nb binding to yeast displayed wild-type H7-HA0 (A/Netherlands/219/2003) and binding of NB7-14, NB7-08, NB7-15, NB7-03, NB7-05 to yeast displayed HA carrying the mutations as indicated. (c) Binding activity to a panel of yeast displayed H7-HA0 mutants with residue numbering relative to HA1 domain. Each Nb is grouped by binding profile. Blue cells indicate the specific Nb used for HA library selections. Commercial H7-HA specific antibody MIA-H7-334 is included as positive control and retains binding to all mutants. Relative Nb binding to each yeast displayed HA mutant was calculated by dividing the MFI (mean fluorescence intensity) of Nb-mutant HA pair with the value for wild type H7-HA incubation and the resulting ratio normalised to percentage values. Binding was categorized as follows, ≤ 15% no binding (red), between 15 and 40% intermediate binding (orange) and ≥ 40% positive binding (green).

