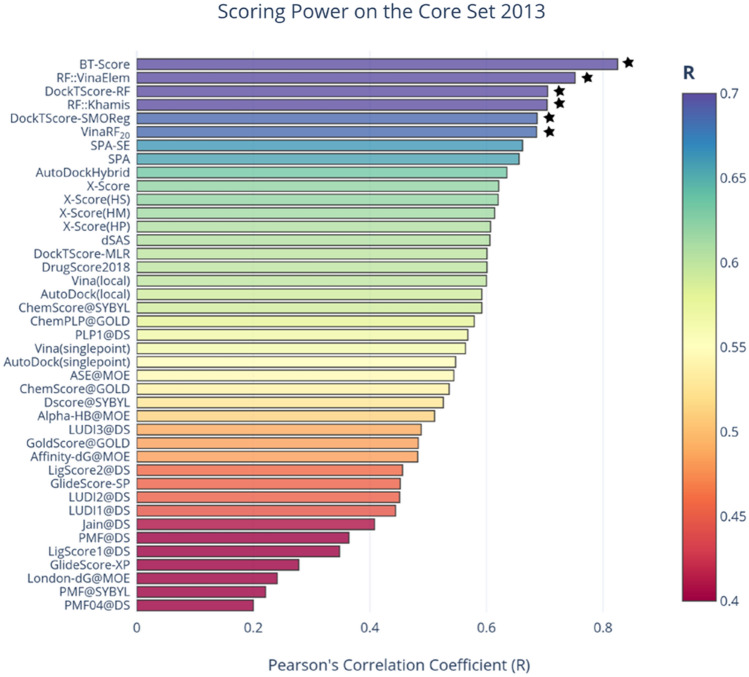
Figure 10.
Scoring power of DockTScore linear and nonlinear models compared to the scoring functions evaluated on the core set 2013. Performances collected from the literature: BT-Score75, CompSPA76, AutoDockHybrid23, and the remaining were recalculated from raw data in the recent work of T. Gaillard77. Nonlinear models are highlighted with a star. Scoring functions with Pearson’s correlation coefficients higher or equal than 0.7 are colored purple and those lower than or equal to 0.4 are colored red.

