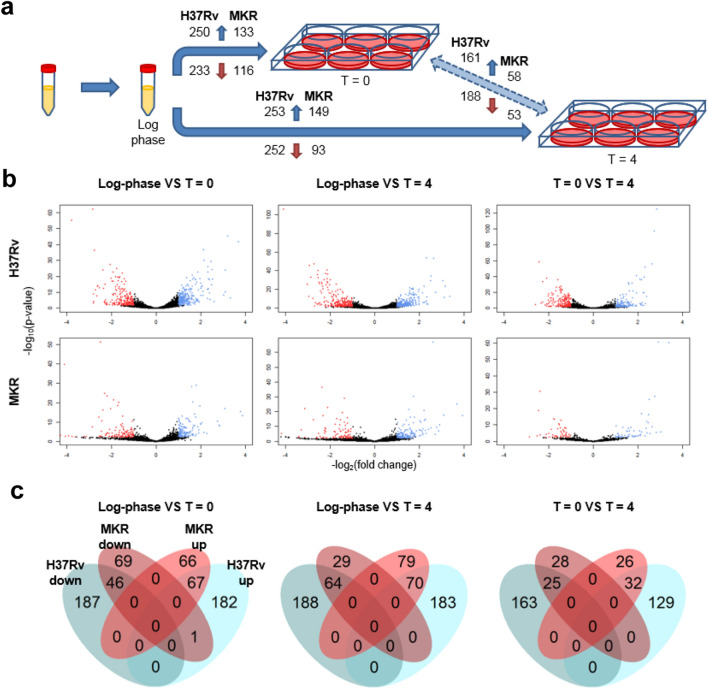
Figure 2.
Differential gene expression analyses. (a) differentially expressed genes were determined among the three biological conditions (baseline VS experimental group: log-phase VS T = 0, log-phase VS T = 4, and T = 0 VS T = 4). The numbers of significantly up-regulated genes are shown on the top of the arrows while the numbers of significantly down-regulated genes are shown on the bottom. (b) Volcano plots (red: down-regulated genes; and blue: up-regulated genes). (c) Venn diagrams illustrating the numbers of differentially expressed genes common and unique among different strains of M. tuberculosis.

