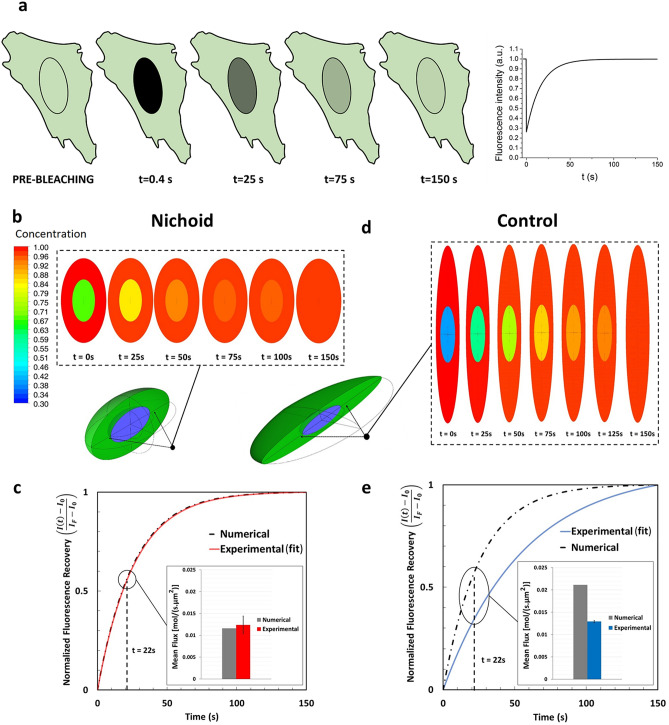
Figure 5.
Passive Nucleo-cytoplasmic protein fluxes of proteins within the Nichoid artificial niche. (a) Representative sketch of FRAP experiment to study fluorescent protein translocation into the cell nucleus and a representative plot of the fluorescence intensity recovery curve. The software used to create the images are Microsoft PowerPoint 2018 (https://products.office.com/it-it/powerpoint) and OriginPro 2019 (https://www.originlab.com/origin). (b) Contour map of GFP concentration on xz-plane at different time points for cells grown into the Nichoid (from numerical simulation). The software used to create the images is Ansys 2019 R2 (www.ansys.com) (c) Comparison of recovery curves and mean fluxes at 22 s after photobleaching for cells grown in the Nichoid: numerical simulation (black dotted curve), FRAP experiments (red curve). (d) Contour map of GFP concentration on xz-plane at different time points for cell on Control cells (from numerical simulation). The software used to create the images is Ansys 2019 R2 (www.ansys.com) (e) Comparison of recovery curves and mean fluxes at 22 s after photobleaching for cells grown on a flat control substrate: numerical simulation (black dot), FRAP experiments (blue). The vertical axis of the graphs (d) and (e) shows the normalized fluorescence intensity for FRAP and normalized concentration for the numerical simulation.

