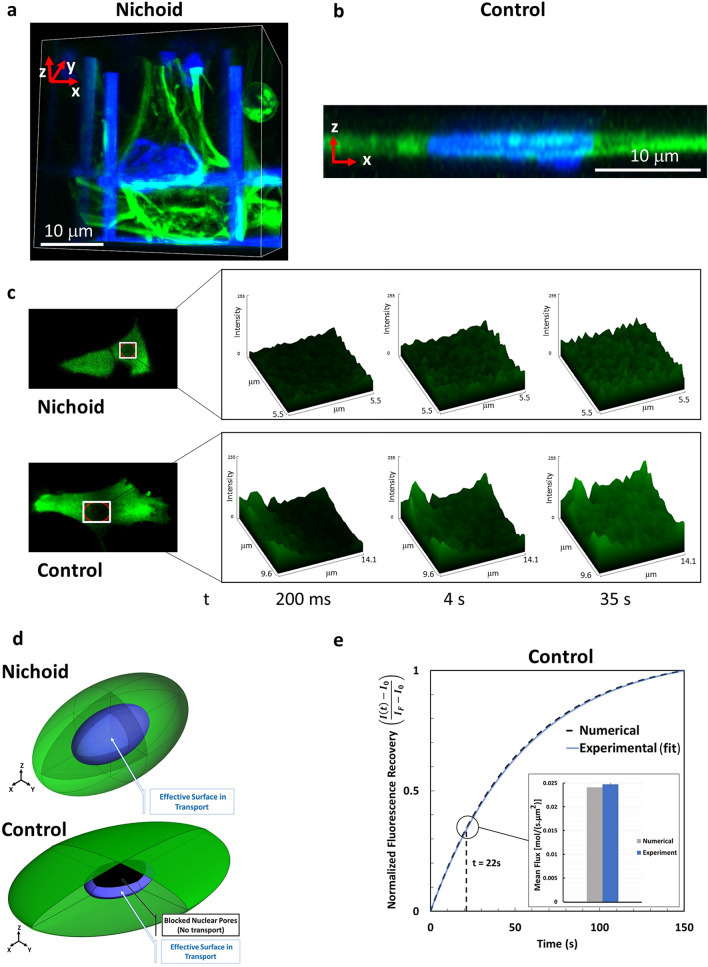
Figure 6.
Effective NE surface for nucleo-cytoplasmic protein fluxes. (a) 3D rendering of MSCs grown in the Nichoid. Actin fibers are in green and the cell nuclei are in blue. The cell nucleus is surrounded by the cell cytosol in each direction. (b) 3D rendering of z-stack images: actin (green) and nuclei (blue). The image shows that on a 2D flat control substrate, MSCs are very thin and the volume of the cell cytosol at the top and the bottom of the nucleus is negligible. (c) Collection of explanatory images of the first seconds after the photobleaching. These results show that, fluorescence recovery starts at the nuclear periphery and gradually diffuses towards the nuclear centrum. In fact, the fluorescence recovery in the nuclear slice is more uniform in the Nichoid than in the Control, where a fluorescence gradient towards the center of the nucleus is clearly visible. On the left there are representative images of MSCs expressing GFP protein. The red ROI highlights the cell nucleus. The white ROI shows the rectangle on which the pixel-by-pixel fluorescence intensity plots were made. From left to right surface plots are shown at different times: 200 ms, 4 s, 35 s. (d) Scheme of the nuclear surface (in blue) exposed for protein transport in MSCs grown into the Nichoid (up) and on a flat glass substrate (down). The software used to create the images is Ansys 2019 R2 (www.ansys.com). (e) Comparison of recovery curve and mean flux within first 22 s after photobleaching for cells on a flat control substrate considering the effective surface of transport: numerical simulation (gray), FRAP experiments (blue).

