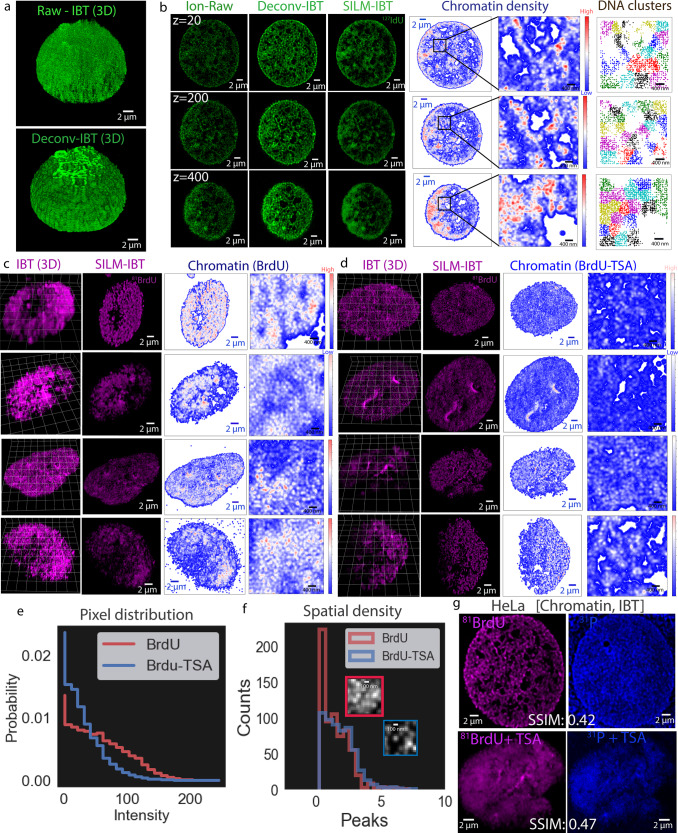
Fig. 3. IBT for assay of chromatin states.
a Thymidine analogue 127I-dU was simultaneously incorporated into HeLa cells for 24 h for chromatin visualization as a replicated DNA signature. IBT reconstructions and deconvolution IBT stacks were represented as 3D renders for 700 tomographic slices. b Replicated DNA images from 127I-dU. The first column shows typical raw ion images from 20th, 200th, and 400th depths from the 127I-dU channel (green). The second column presents reconstructed 127I-dU images by Deconvolution-IBT. The third column corresponds to SILM-IBT images of the same chromatin target and these images were then converted to chromatin density maps (blue to red: low to high). The fourth and fifth columns (zoomed out version) show corresponding chromatin density maps. DNA clusters (n = 10) were assigned to unique colors on the spatial chromatin maps. c HeLa cells were treated with a histone deacetylase (HDAC) inhibitor, Trichostatin A (TSA), for 24 h, after labeling of replicated DNA for 24 h by 81Br-dU. Four HeLa cells were only labeled by 81Br-dU without TSA and up to 30 slices were acquired by SIMS. d Another set of four HeLa cells were treated by TSA and imaged. Chromatin density maps were created in the SILM-IBT images from these four cells. The cells that are treated with TSA consistently showed dimmer ion signals and more relaxed DNA features. e Intensity analysis of chromatin (BrdU, n = 4) and TSA treated chromatin (BrdU-TSA, n = 4) for an average of all the eight cells, yielding lower signal levels for TSA treated cells. f Spatial density analysis for peak distributions in a pair of cells with and without TSA, a reduction in the counts of peaks was detected. Insets: 20 × 20 pixels from each BrdU and BrdU-TSA images. g Chromatin features in a HeLa cell imaged using 31P channel together with 81Br-dU labeling for replicated DNA. Upper images: HeLa cell imaged using the IBT data from 81Br-dU and 31P channels, exhibiting 0.42 SSIM values. Lower images: Another HeLa cell for the same 81Br-dU and 31P channels after TSA treatment. IBT-sum images of 30 frames for 81Br-dU and 31P, providing SSIM values of 0.47.

