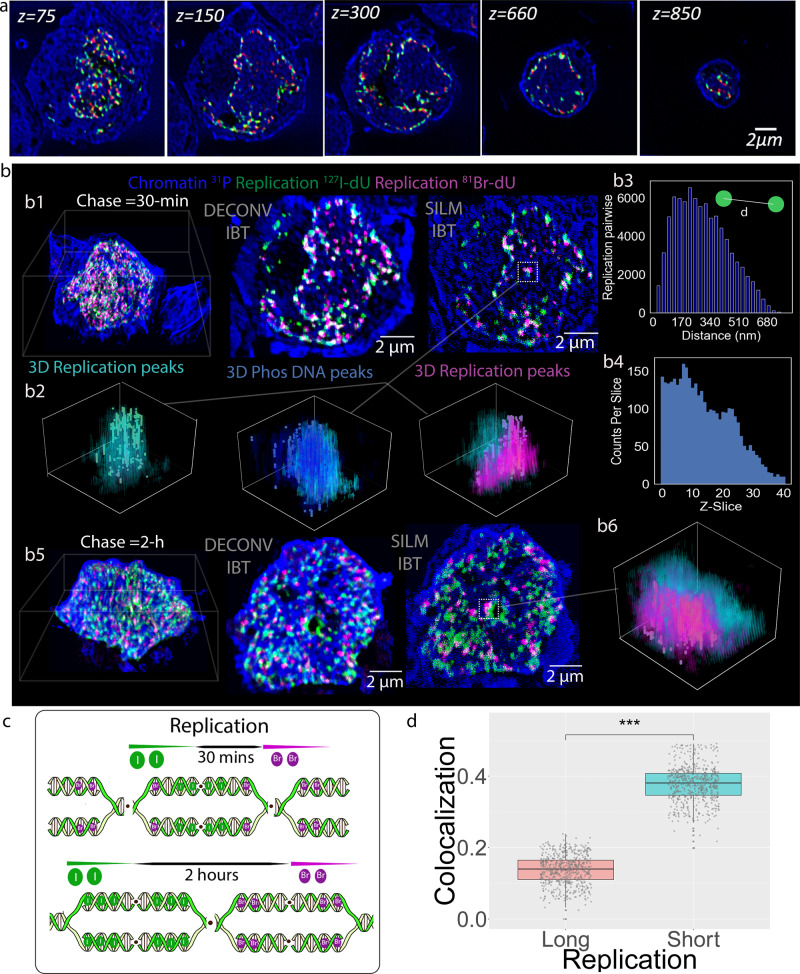
Fig. 4. Ion-beam tomograms reveal overlaps and domains in the 3D distribution of DNA replication sites.
a Nalm6 cells were incubated with 127I-dU for 30 min and then without a label for 30 min or 2 h, followed by a 30 min incubation with 81Br-dU. The endogenous DNA backbone was visualized in the 31P channel (blue) and replication sites were detected in the 127I-dU (green) and 81Br-dU (red) channels. IBT images are shown from the 75th slice to the 850th slice of the cell. b Upper images: 3D visualization of 31P (blue), replication sites labeled with 127I-dU (green), and replication sites labeled with 81Br-dU (magenta) across 1000 slices with a 30 min chase and 2 h chase. b1 The 3D spatial distributions across 100 tomographic slices of replication sites for Deconvolution-IBT and SILM-IBT are illustrated. b2 In the SILM-IBT, peaks were identified in a single replication site and shown as green circles for 127I-dU replication, blue circles for phosphorus, and magenta circles for 81Br-dU replication. b3 Histogram of pairwise distances between the 127I-dU replication peaks, yielding an average 170 nm separation with a wide range extending to 600 nm. b4 Peak counts per slice in the 127I-dU channel across 40 slices. Lower images: 3D render of 31P (blue) across 800 slices. b5 In the middle and right images, the spatial distributions across 100 slices are presented for chromatin with31P (blue), replication sites labeled with 127I-dU (green), and 81Br-dU (magenta) in the form of Deconvolution-IBT and SILM-IBT renders, respectively. b6 Peaks identified in the 81Br-dU channel overlaid with the original values of both 127I-dU and 81Br-dU replication voxels. c Schematic of the shorter chase time (30 min) for the replication site, leading to higher spatial overlap than the longer chase. d Box plot of co-localization of 127I-dU and 81Br-dU channels for the 2 h (long) and 30 min (short) chase experiments. Median, first and third quartile, and 95% confidence interval of the median are shown. Each data point corresponds to co-localization values per ion beam depth (n = 600 slices over a long IBT scan), providing a significant p-value < 2.2e-16 (***) by the Wilcox test (Two-sided).

