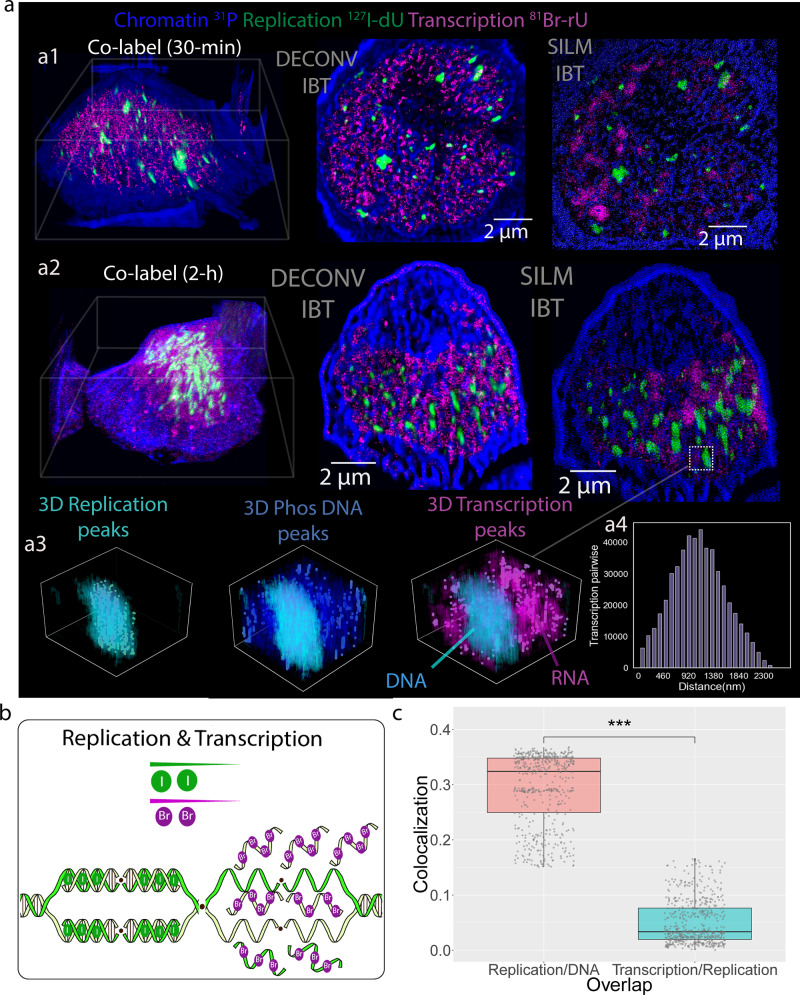
Fig. 5. Spatial segregation of replication and transcription visualized by ion beam tomography.
a Transcript synthesis was detected with 81Br-rU (magenta), and DNA replication was detected with 127I-dU (green) by simultaneous 30 min and 2 h incubation of Nalm6 cells with labels. The 31P channel (blue) reflects primarily nucleic acids. a1 Nalm6 cell co-labeled to visualize RNA and DNA synthesis for 30 min. The first image shows the 3D render. The middle image illustrates the Deconv-IBT images for RNA transcripts (magenta) and replicating DNA (green) near the chromatin (blue). The right image shows the SILM-IBT results for 100 slices from three channels. a2 Another Nalm6 cell co-labeled for RNA and DNA synthesis for 2 h. From left to right: 3D render, Deconv-IBT, SILM-IBT results for 127I-dU, 81Br-rU, and Phosphorous channels. a3 In the SILM-IBT data, high-density signals in replicated DNA tomograms (3D replication peaks) were localized and identified by a green synthetic circle, and also overlaid by the semi-transparent 3D visual of the original voxel values. Similarly, peaks in the phosphorus and transcription channels were also identified and overlaid with the original voxel distributions. In the 3D transcription plot, the DNA phase and RNA phase were separately obtained, suggesting a clear phase separation approach. a4 Transcription peaks were separated by distances that exhibited a range from 100 nm to 1.7 µm and averaged around 1.1 µm. b As shown schematically, our data indicate that replication and transcription types of machinery are spatially segregated. Iodine (I) was incorporated into the replication forks and bromine (Br) was added to newly synthesized RNAs. c Box plot of co-localization of transcription and replication pixels. Each data point represents an ion beam depth section (n = 550 slices over a long IBT scan). The difference in the box plots had a significant p-value < 2.2e−16 (***) by the Wilcox test (Two-sided). Median, first and third quartile, and 95% confidence interval of the median are shown.

