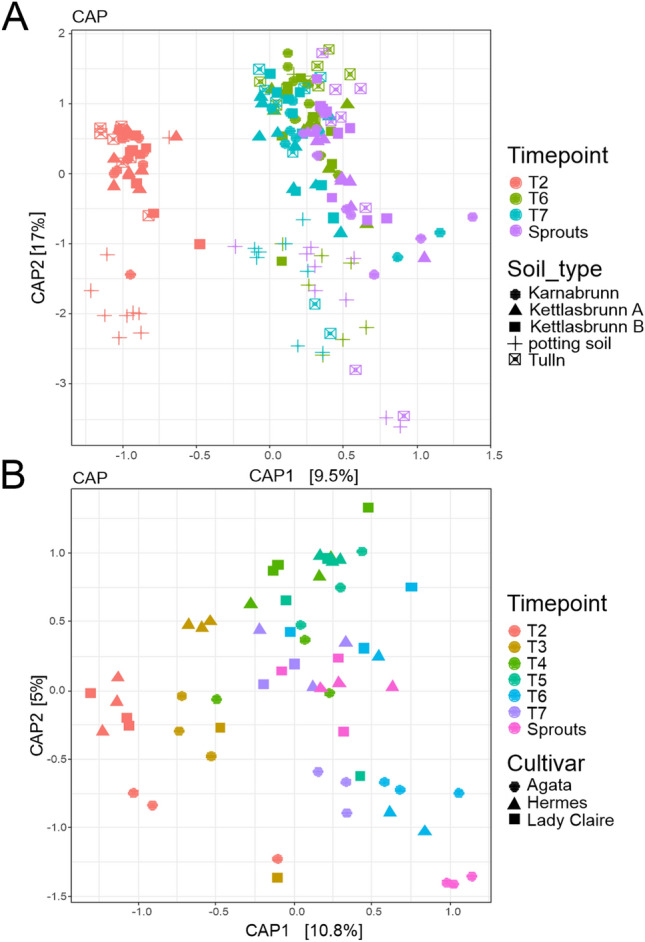
Figure 2.

Constrained analysis of principal coordinates (CAP) of Bray–Curtis dissimilarities. CAP based on the V5–V7 regions of the 16S rRNA gene investigated for (A) tubers of the varieties (Agata, Lady Claire and Hermes) sampled at T2, T6 and T7 and (B) tubers of the varieties (Agata, Lady Claire and Hermes) sampled at T2-7 as well as sprout samples at T7. An overview of potato cultivars, soil types and sampling time points is shown in Fig. 1.
