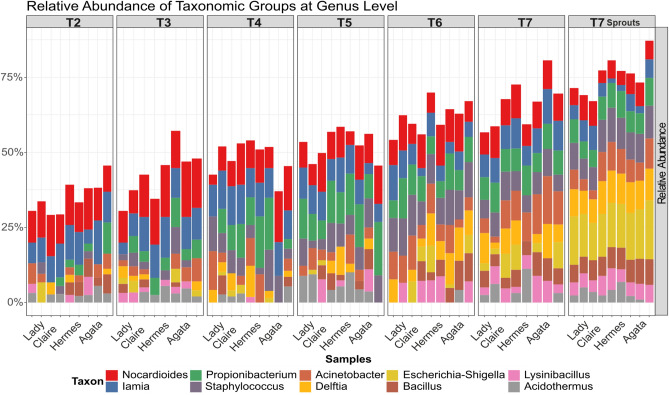
Figure 3.
Differentially abundant taxa at the genus level. Visualization of differentially abundant taxonomic groups at the genus level of the bacterial community in tubers of three different potato cultivars (Agata, Hermes and Lady Claire) at all sampling time points T2-7 as well as in sprout samples at T7. Differentially abundant taxa were calculated with the function varSelRF48 and visualized in barplot with the function group.abundant.taxa of the R package RAM47.

