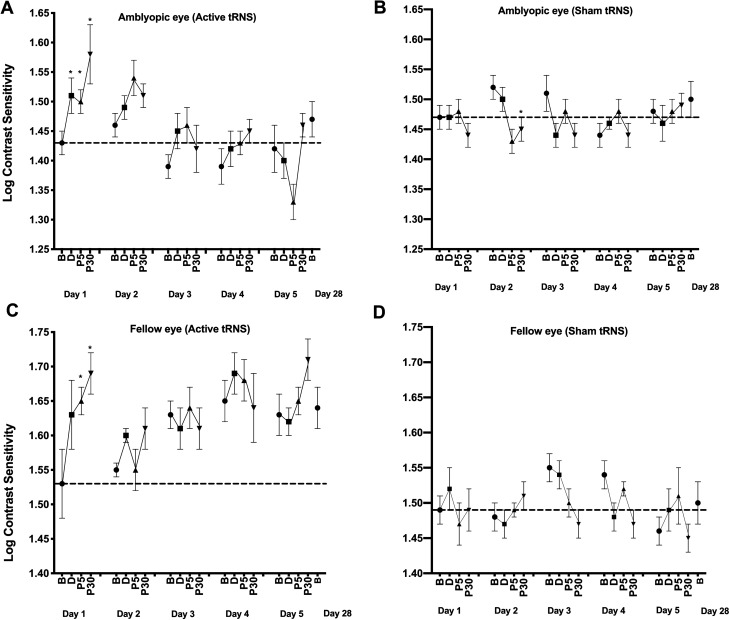
Figure 3.
The effects of tRNS on contrast sensitivity during each daily session and at the day 28 follow-up visit. Data are shown separately for the amblyopic (A and B) and fellow (C and D) eyes and for the active (A and C) and control (B and D) groups at baseline and during, 5 min (P5) and 30 min (P30) post tRNS. *Statistically significant difference from baseline (p < 0.05). Error bars show within-subject standard error of the mean (SEM). The dashed horizontal lines represent the mean before-stimulation threshold on day 1. Larger y-axis values indicate better contrast sensitivity.

